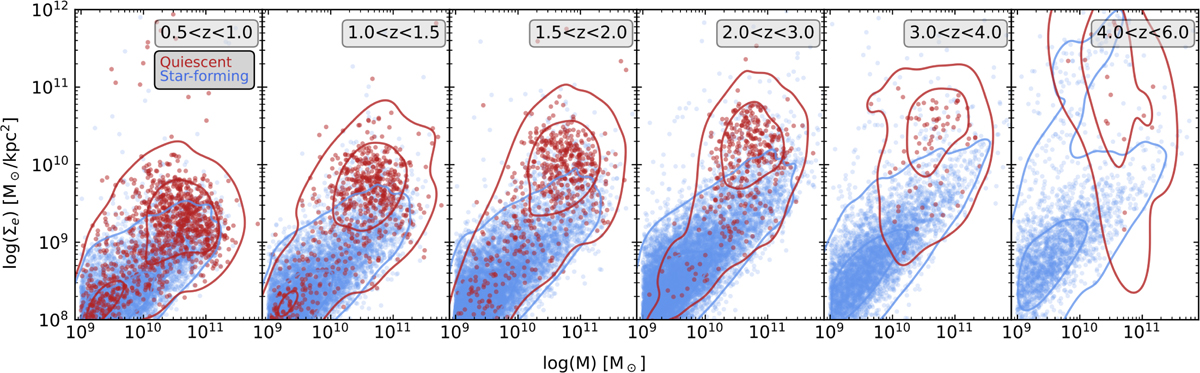
Fig. 9
Download original image
Evolution of the stellar mass surface density, Σe. Shown are masses and redshifts from the DJA, calculated using EAZY, and effective radii, re, measured by SOURCEXTRACTOR++ in this work. Galaxies are classified as quiescent or star-forming according to their position in the UVJ diagram. The contour lines result from kernel density estimation using seaborn.kdeplot. The data for this figure includes 45 201 galaxies such that log M★/M⊙ > 9.
Current usage metrics show cumulative count of Article Views (full-text article views including HTML views, PDF and ePub downloads, according to the available data) and Abstracts Views on Vision4Press platform.
Data correspond to usage on the plateform after 2015. The current usage metrics is available 48-96 hours after online publication and is updated daily on week days.
Initial download of the metrics may take a while.