Fig. 4
Download original image
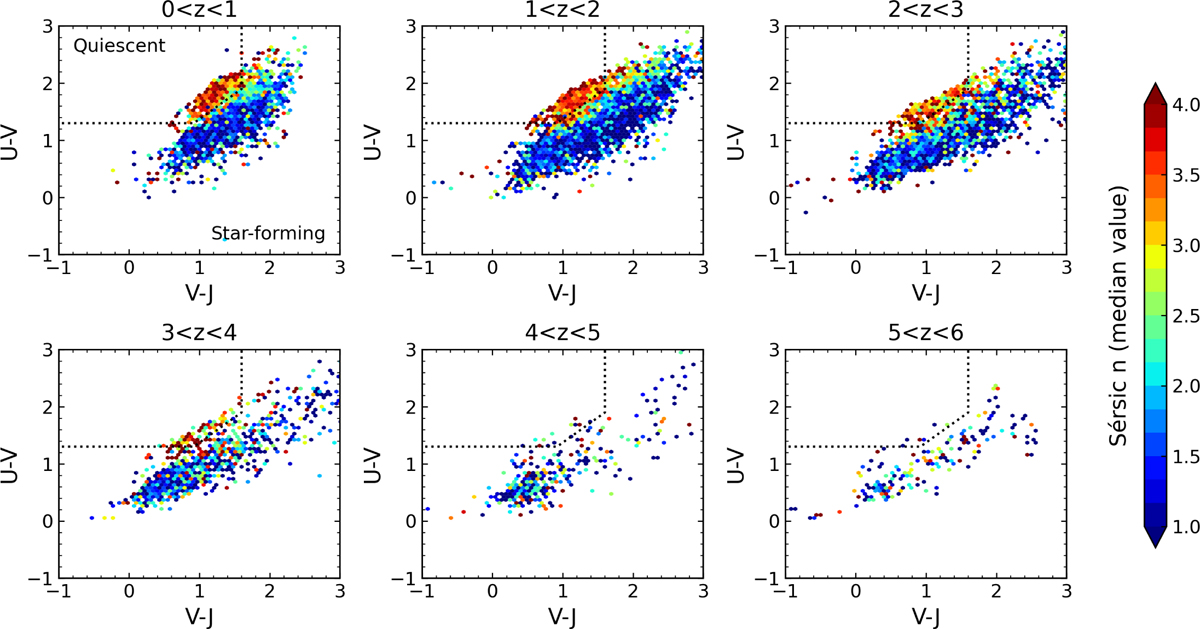
Distribution of Sérsic indices, nS, in the UVJ color space for different redshift ranges, for galaxies with log M★/M⊙ > 10. The color of each hexagonal bin represents the median value of nS, as indicated by the colorbar. The dotted line shows the quiescent vs. star-forming separation using Eq. (2). The quiescent region is predominantly populated by galaxies with high Sérsic indices (nS > 3).
Current usage metrics show cumulative count of Article Views (full-text article views including HTML views, PDF and ePub downloads, according to the available data) and Abstracts Views on Vision4Press platform.
Data correspond to usage on the plateform after 2015. The current usage metrics is available 48-96 hours after online publication and is updated daily on week days.
Initial download of the metrics may take a while.