Fig. 2
Download original image
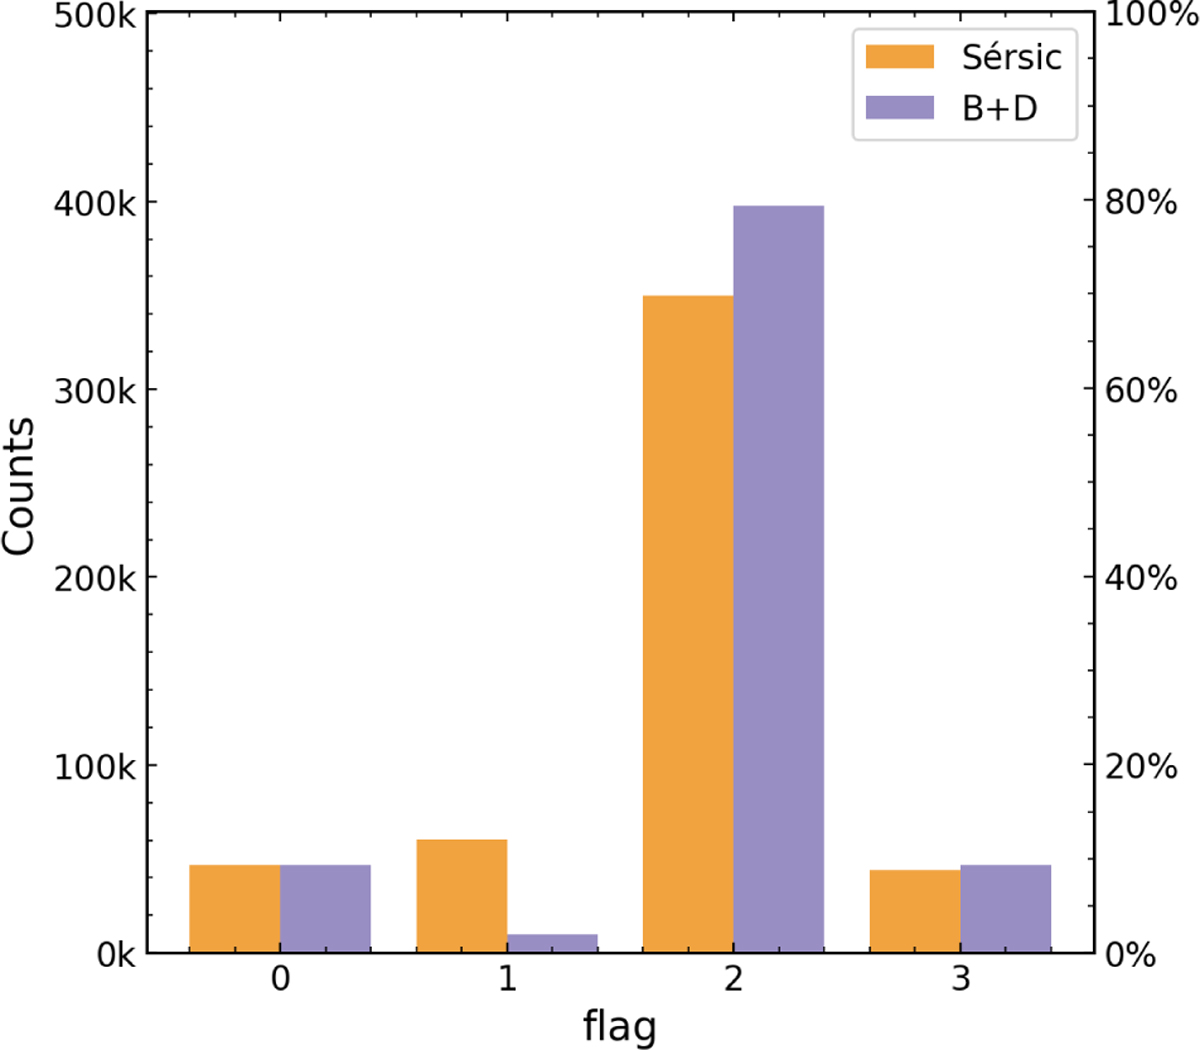
Histogram of the flag values for the full catalogs. The percentages are relative to the total number of sources in the DJA catalogs. Two distinctive histograms for the Sérsic and Bulge+Disk models are shown because their fitting success rates differ. The figure shows a vast majority (70–80%) of sources are correctly fitted and provides science-ready morphological data.
Current usage metrics show cumulative count of Article Views (full-text article views including HTML views, PDF and ePub downloads, according to the available data) and Abstracts Views on Vision4Press platform.
Data correspond to usage on the plateform after 2015. The current usage metrics is available 48-96 hours after online publication and is updated daily on week days.
Initial download of the metrics may take a while.