Fig. 6.
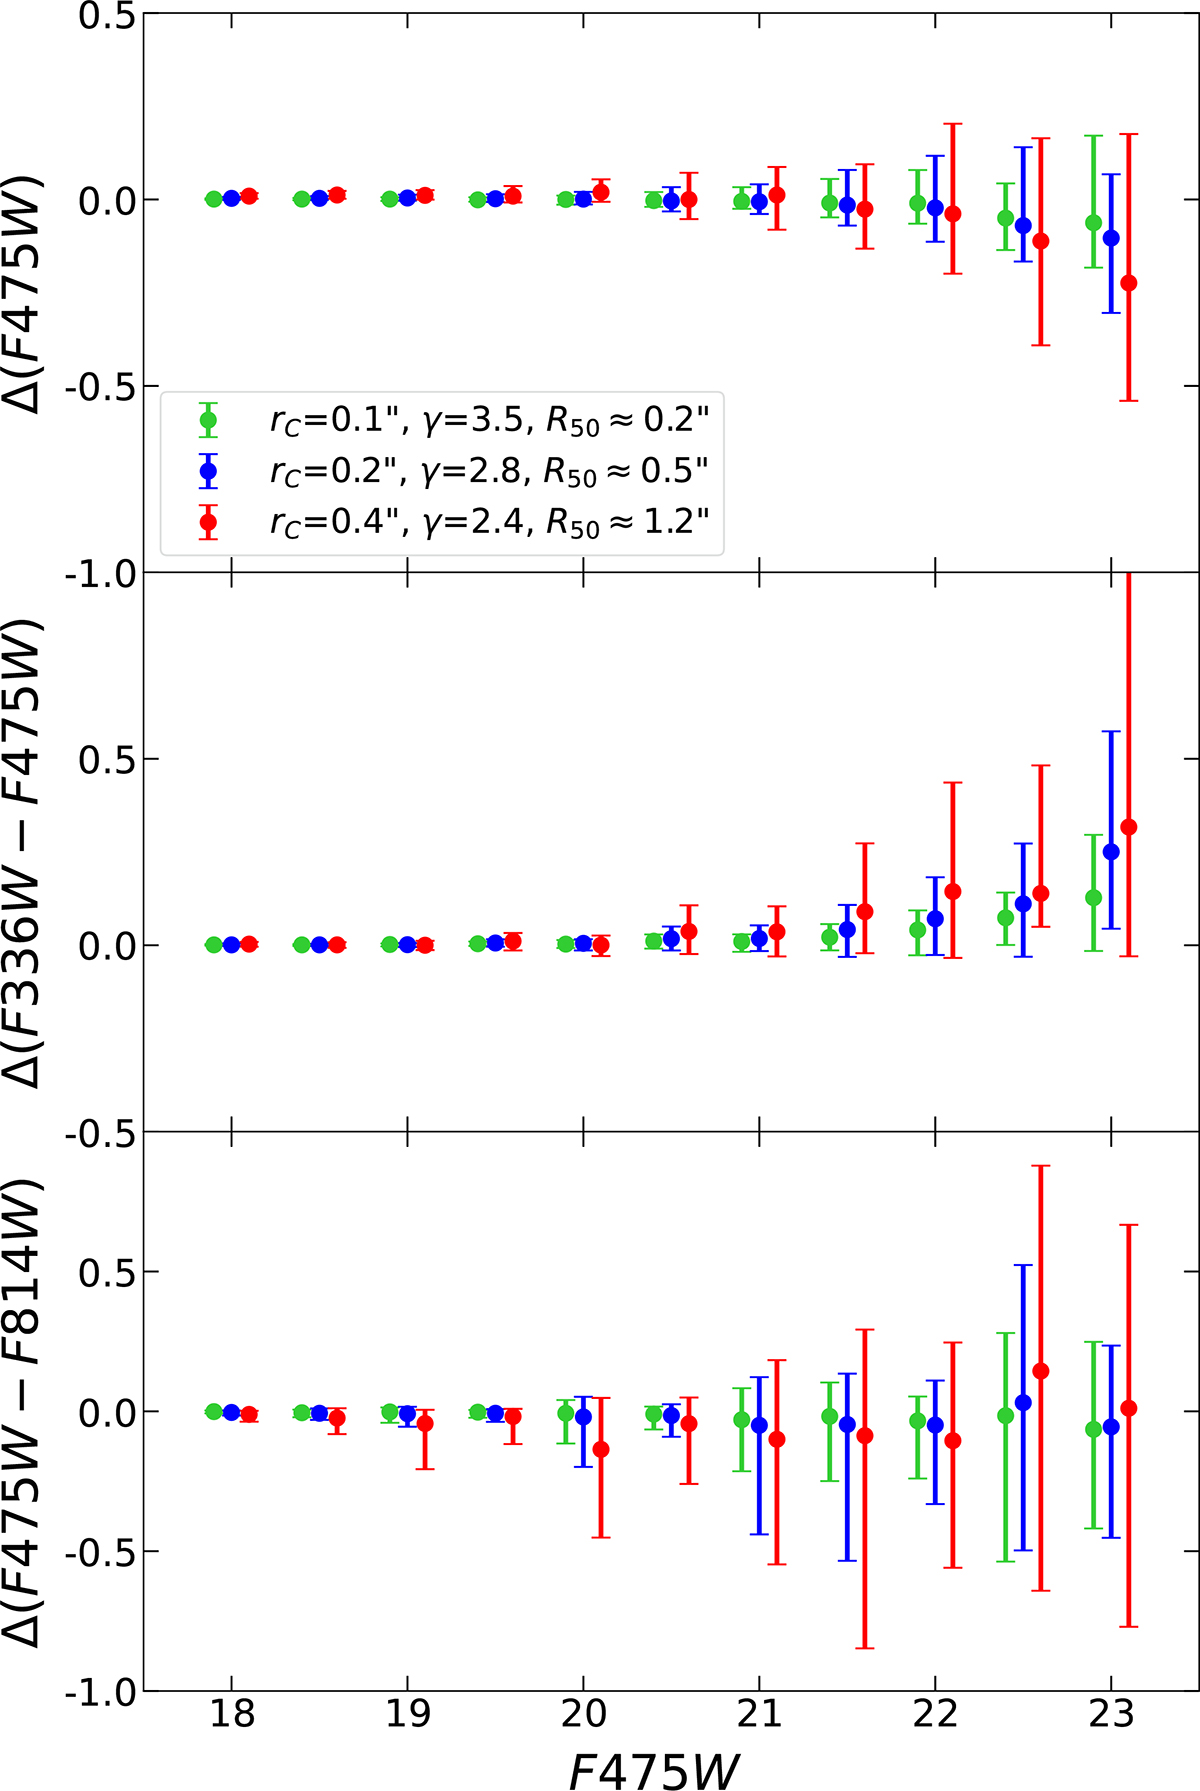
Download original image
Differences in F475W (top), F336W−F475W (middle), and F475W−F814W (bottom), calculated as measurements in the B3 field minus the ones in the B0 field, versus the F475W cluster magnitude measured in the B0 field. Results are shown for the same combinations of geometric parameters (rc and γ) as in Fig. 4 (see legend, where approximate median half-light radii R50 are also included for reference). Markers show the median differences; error bars indicate the 16th–84th percentile ranges. Blue and red markers are slightly offset along the X axis for clarity.
Current usage metrics show cumulative count of Article Views (full-text article views including HTML views, PDF and ePub downloads, according to the available data) and Abstracts Views on Vision4Press platform.
Data correspond to usage on the plateform after 2015. The current usage metrics is available 48-96 hours after online publication and is updated daily on week days.
Initial download of the metrics may take a while.