Fig. 1.
Download original image
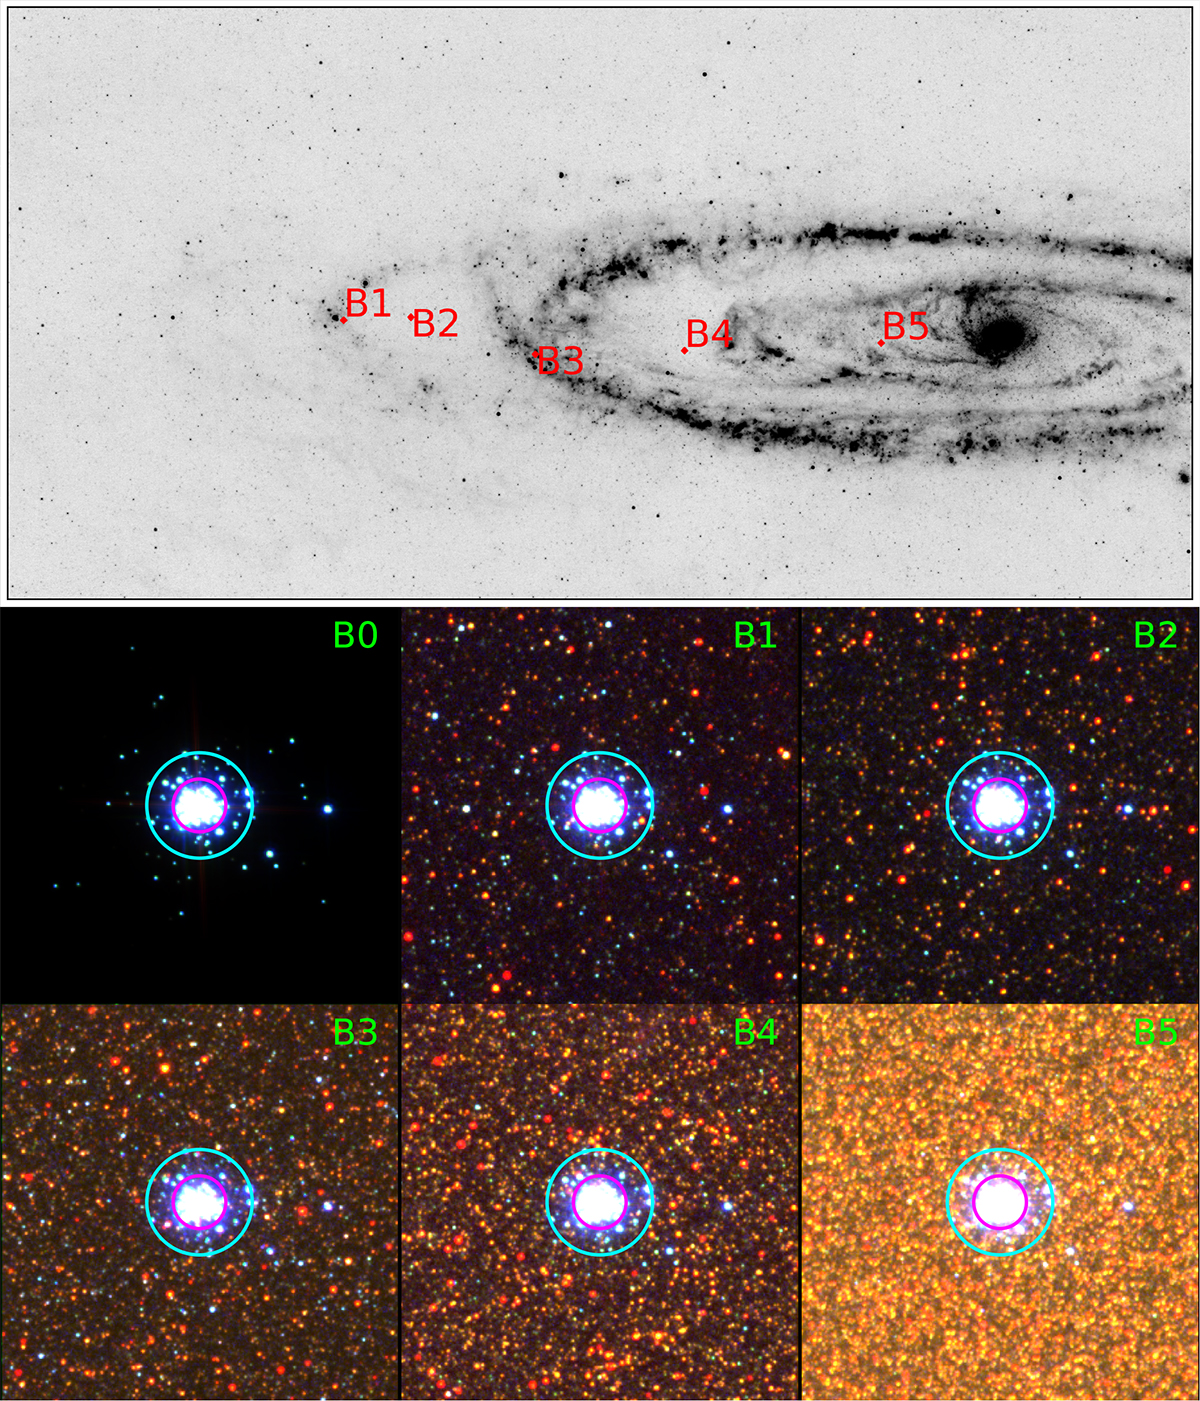
Background fields in M 31. The top panel shows a grey-scale 24 μm map of M 31 (Multi-Band Imaging Photometer for Spitzer, Spitzer/MIPS) with the marked locations of background fields (B1–B5). The bottom panels show images of the artificial star cluster (log(M/M⊙) = 3.5, log(t/yr) = 7.0, rc = 0.2″, and γ = 2.8) placed in each of the background fields. B0: Background-less case. Magenta and cyan circles mark apertures with radii Rap = 1″ and 2″, respectively. The colour images (15″×15″) were produced by combining F336W, F475W, and F814W data.
Current usage metrics show cumulative count of Article Views (full-text article views including HTML views, PDF and ePub downloads, according to the available data) and Abstracts Views on Vision4Press platform.
Data correspond to usage on the plateform after 2015. The current usage metrics is available 48-96 hours after online publication and is updated daily on week days.
Initial download of the metrics may take a while.