Fig. 7
Download original image
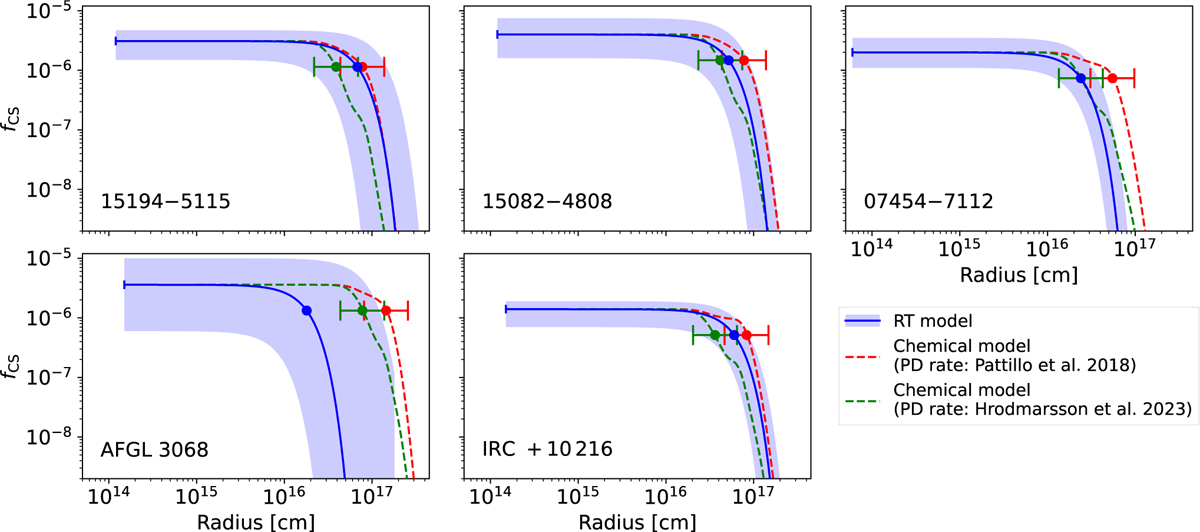
Comparison of CS abundance profiles obtained from RT modelling (blue) and chemical modelling: red - using CS photodissociation rate from Pattillo et al. (2018), green: using CS photodissociation rate calculated from the cross sections from Hrodmarsson & van Dishoeck (2023), based on Xu et al. (2019). The shaded blue region represents the 1σ uncertainty range in the RT model abundance profiles. The circles denote the Re of the respective models. The red and green error bars on the chemical model Re denote the estimated uncertainty in the chemical models (Van de Sande et al., in prep.). It is assumed that this uncertainty does not vary significantly with the outflow density and photodissociation rate (see text).
Current usage metrics show cumulative count of Article Views (full-text article views including HTML views, PDF and ePub downloads, according to the available data) and Abstracts Views on Vision4Press platform.
Data correspond to usage on the plateform after 2015. The current usage metrics is available 48-96 hours after online publication and is updated daily on week days.
Initial download of the metrics may take a while.