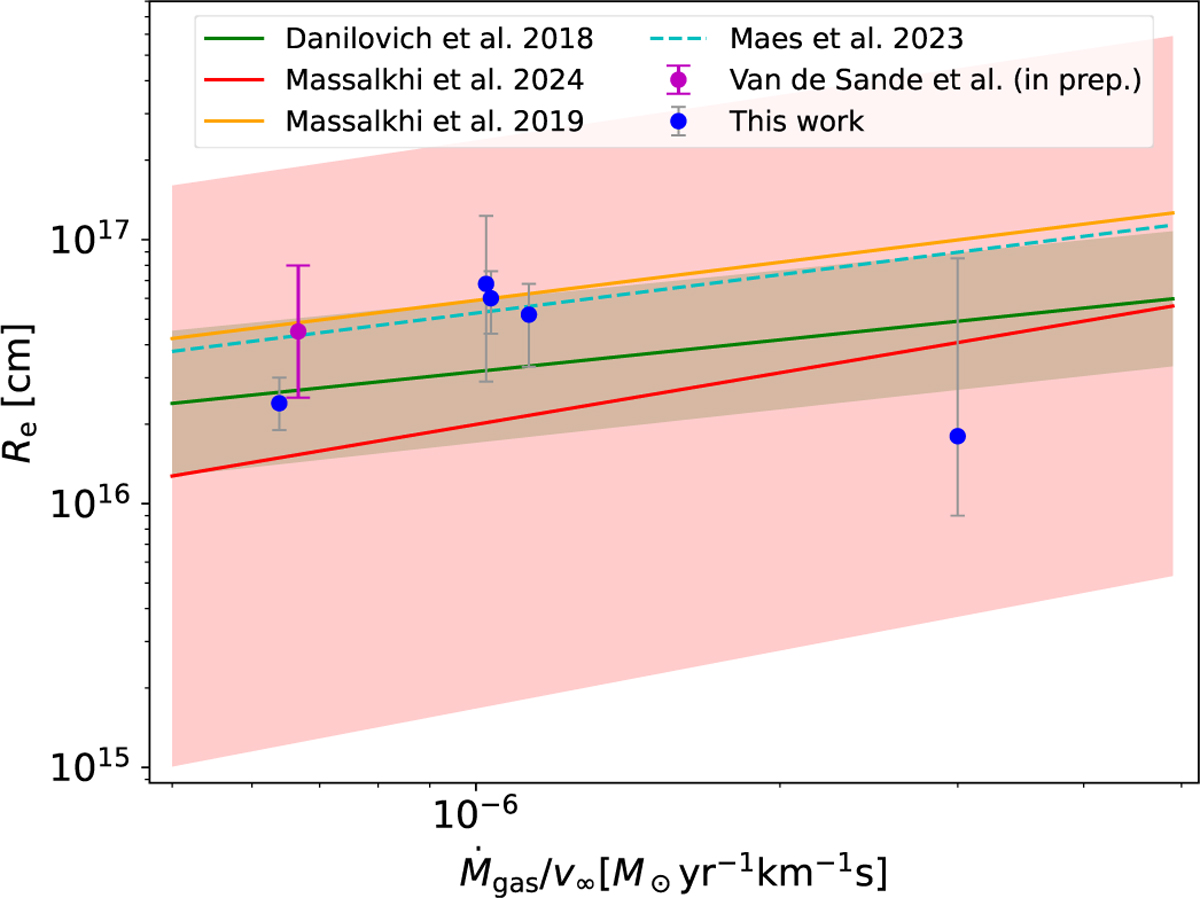
Fig. 6
Download original image
Variation in e-folding radius of the CS abundance profiles with circumstellar gas density. The dashed cyan line (Maes et al. 2023) is from chemical modelling results, while the other trends plotted are calculated from RT models. The magenta point is obtained from chemical modelling results (Van de Sande et al., in prep.), for a star of MLR 1.0×10⁻⁵ Mʘ yr−1 and a ν∞ of 15 km s−1, and the corresponding uncertainty range is estimated from sensitivity calculations on chemical models (see text). The rightmost blue circle is for AFGL 3068, and is likely underestimated (see text).
Current usage metrics show cumulative count of Article Views (full-text article views including HTML views, PDF and ePub downloads, according to the available data) and Abstracts Views on Vision4Press platform.
Data correspond to usage on the plateform after 2015. The current usage metrics is available 48-96 hours after online publication and is updated daily on week days.
Initial download of the metrics may take a while.