Fig. 3
Download original image
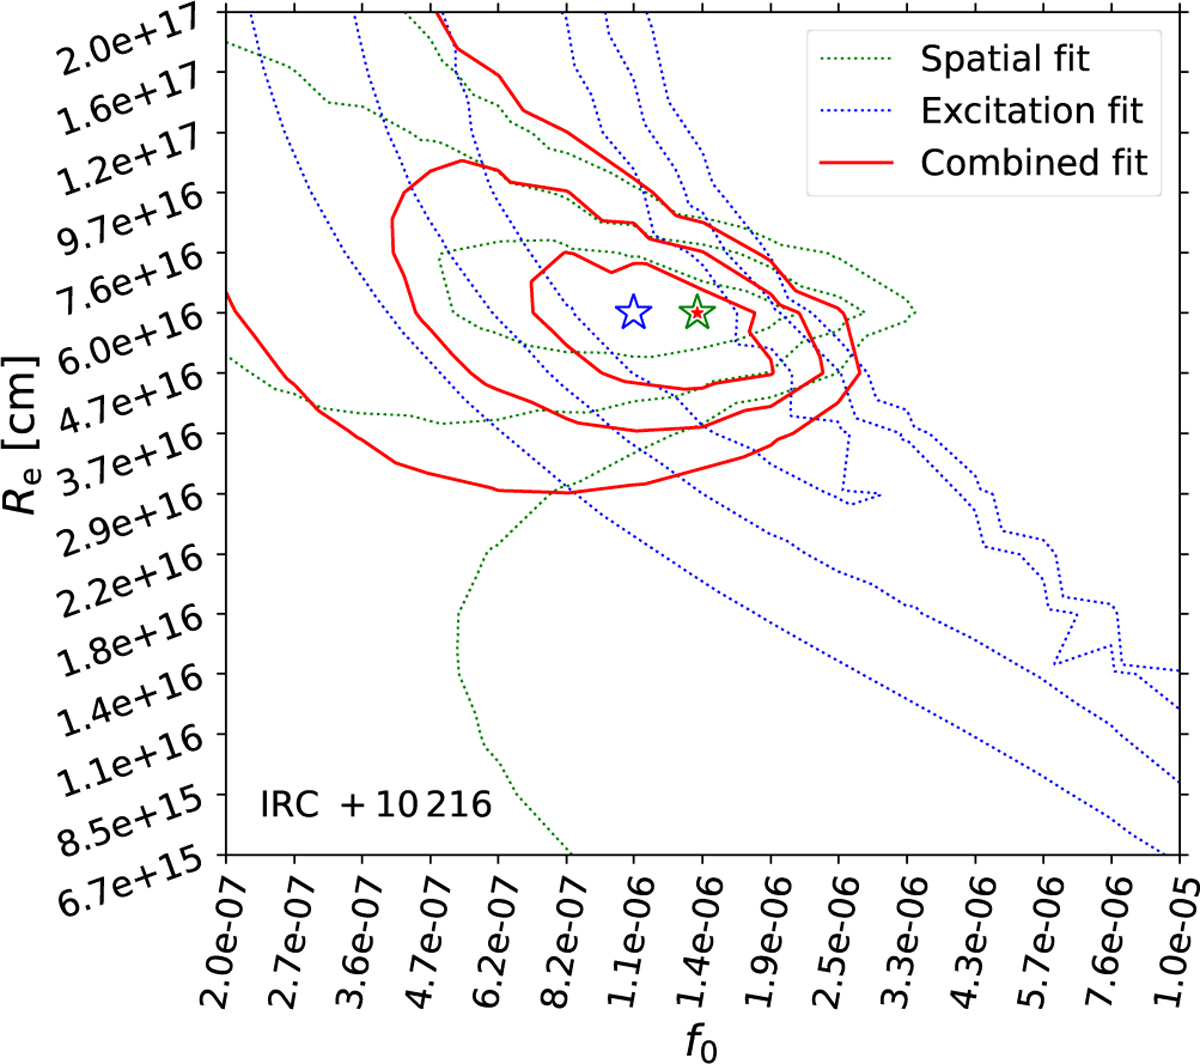
χ2 values for our grid of CS models for IRC +10 216. The contours denote 1σ, 2σ, and 3σ ranges, when constrained using only the spatial information from the CS J = 2-1 line (green) vs just the excitation information from the different J lines (blue). Also shown are the contours when using both the spatial and excitation information simultaneously (red) to constrain the RT models. The green, blue, and red stars mark the best-fit models estimated from the above three cases, respectively.
Current usage metrics show cumulative count of Article Views (full-text article views including HTML views, PDF and ePub downloads, according to the available data) and Abstracts Views on Vision4Press platform.
Data correspond to usage on the plateform after 2015. The current usage metrics is available 48-96 hours after online publication and is updated daily on week days.
Initial download of the metrics may take a while.