Open Access
Fig. C.5
Download original image
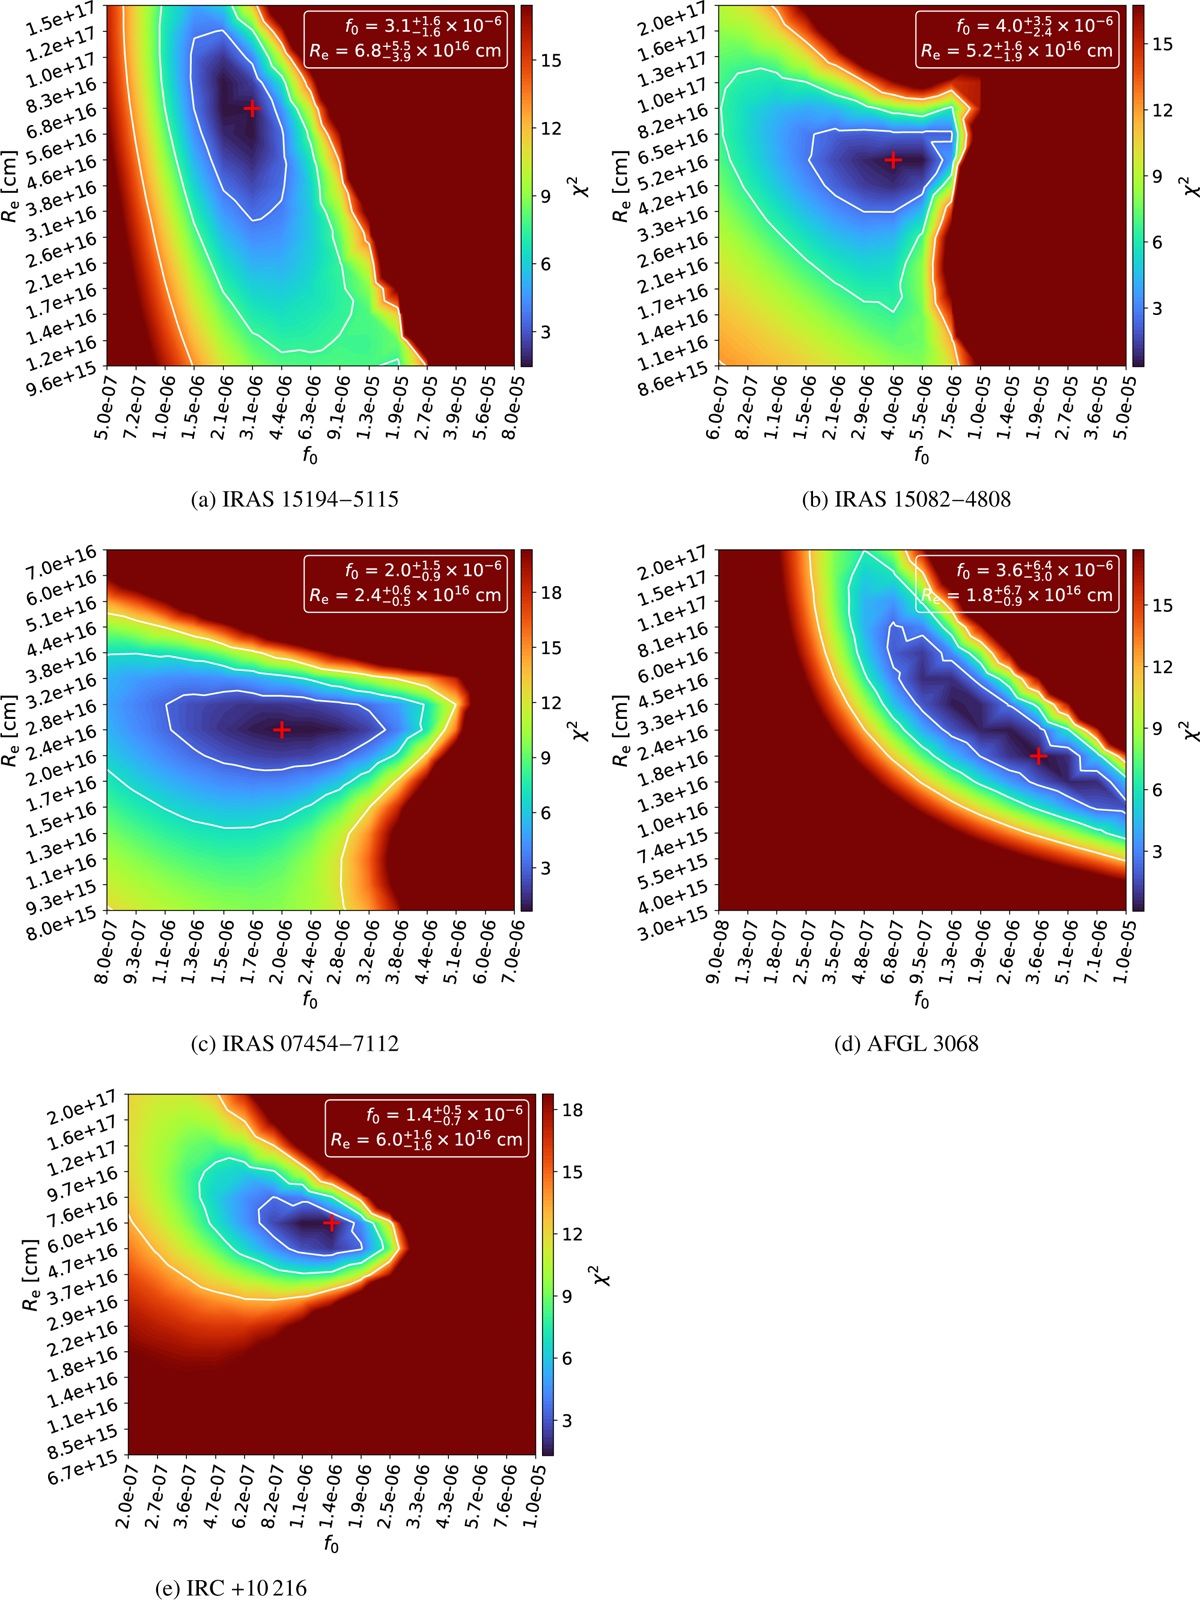
χ2 maps for the CS RT models. The free parameters f0 and Re are on the x- and y-axes, respectively. The red + sign denotes the best-fit model, and the white contours correspond to the 1σ, 2σ, and 3σ ranges.
Current usage metrics show cumulative count of Article Views (full-text article views including HTML views, PDF and ePub downloads, according to the available data) and Abstracts Views on Vision4Press platform.
Data correspond to usage on the plateform after 2015. The current usage metrics is available 48-96 hours after online publication and is updated daily on week days.
Initial download of the metrics may take a while.