Fig. 1
Download original image
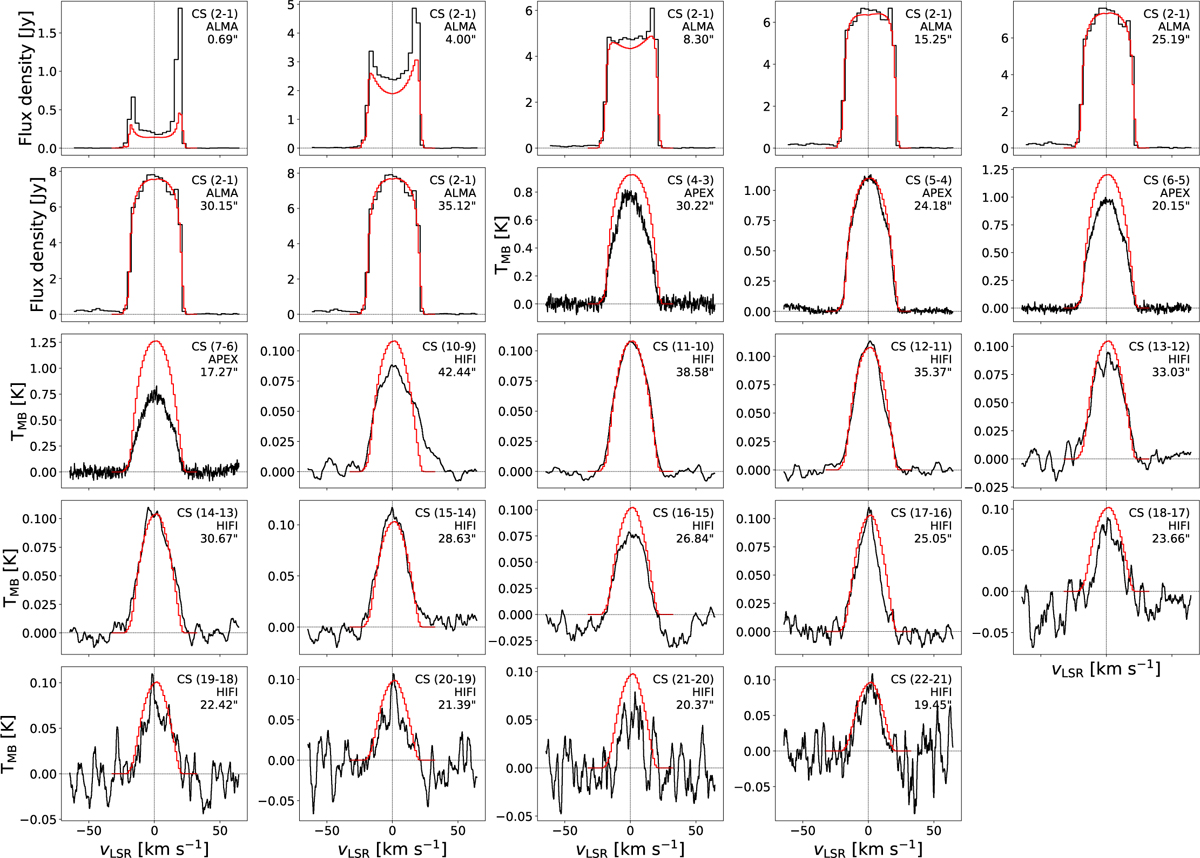
Observed (black) and modelled (red) CS line profiles for IRAS 15194-5115. The transition quantum numbers, telescope used for the observation, and the corresponding beam size in arcseconds are listed at the top right corner of each panel. The line fluxes are in units of Jansky for the ALMA spectra, whereas they are given in the main-beam temperature (TMB [K]) scale for all SD spectra shown.
Current usage metrics show cumulative count of Article Views (full-text article views including HTML views, PDF and ePub downloads, according to the available data) and Abstracts Views on Vision4Press platform.
Data correspond to usage on the plateform after 2015. The current usage metrics is available 48-96 hours after online publication and is updated daily on week days.
Initial download of the metrics may take a while.