Fig. 3.
Download original image
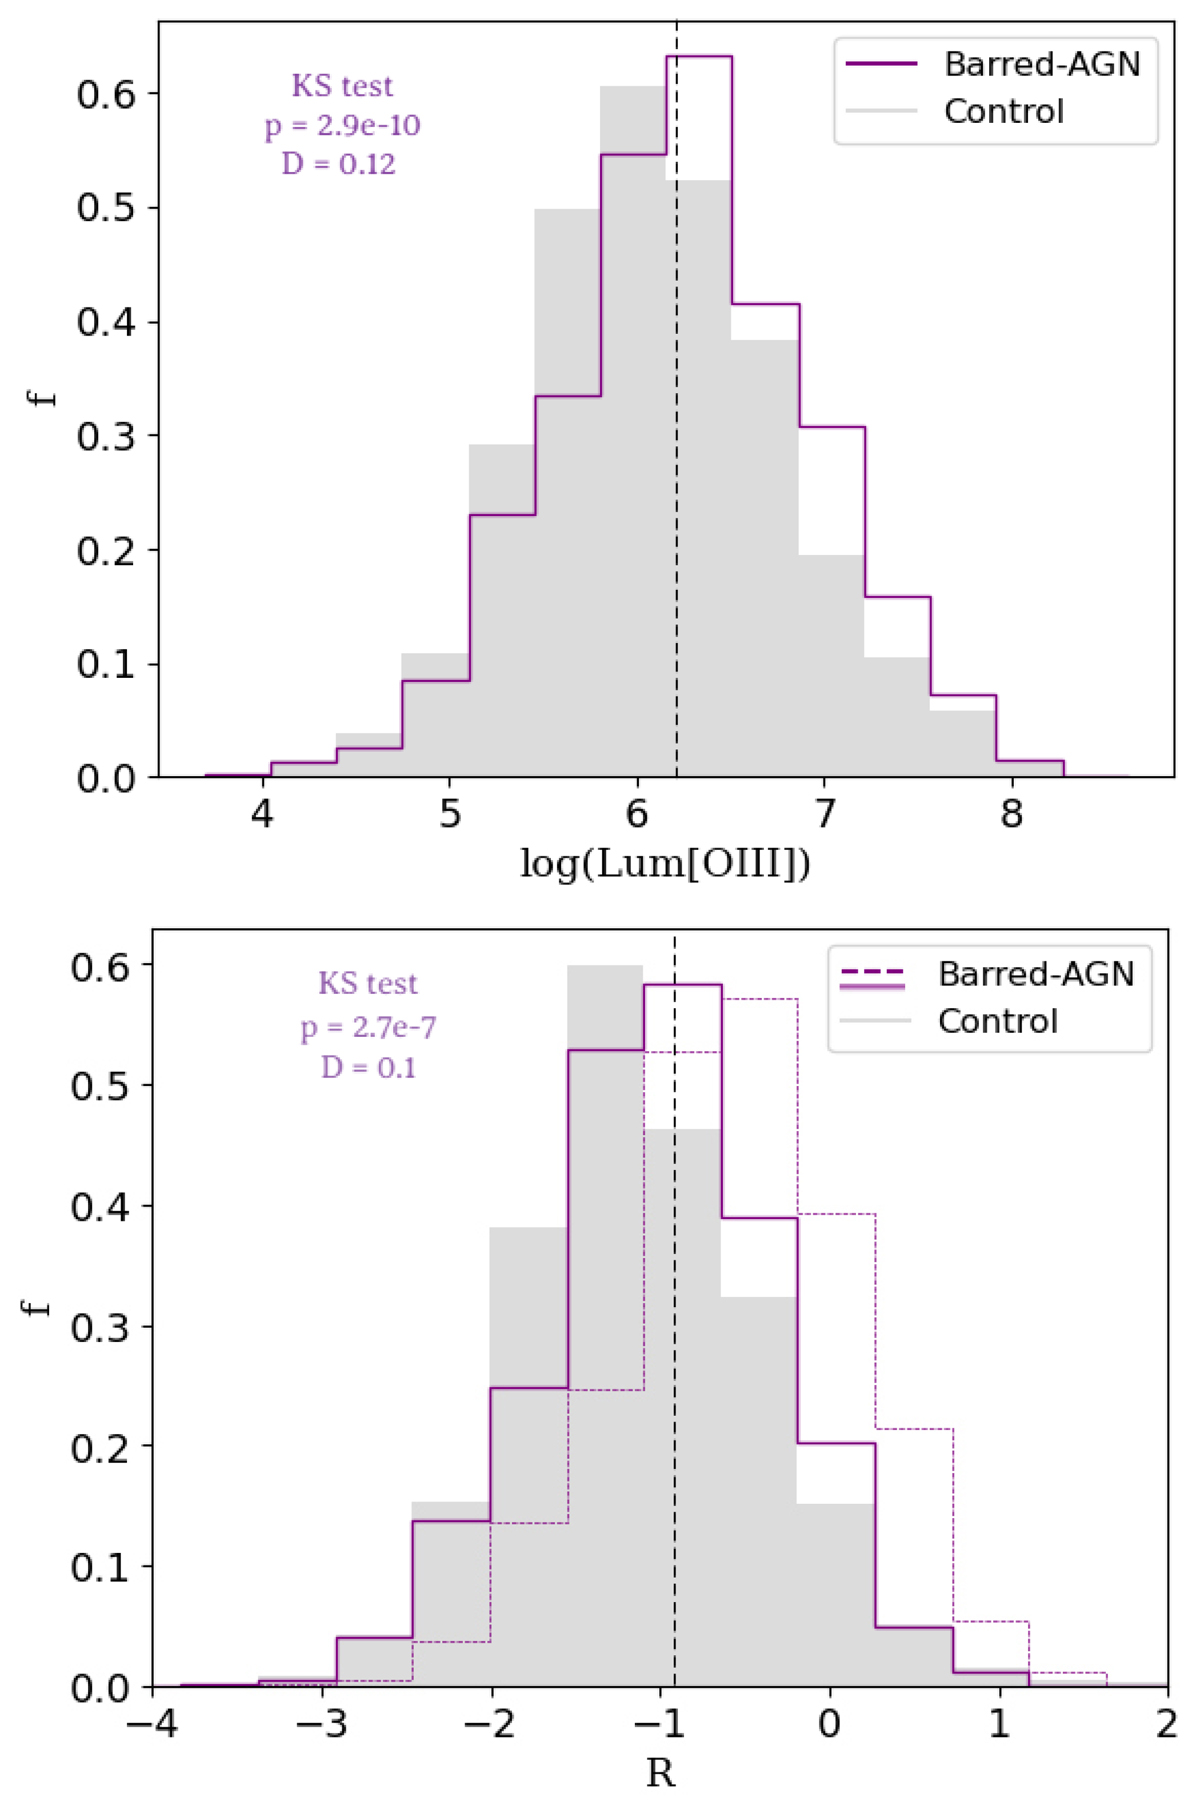
Normalized distributions of log(Lum[OIII]) (top panel) and the accretion rate ℛ (bottom panel). The solid line represents the ℛ distribution using the same α and β parameter for both barred and unbarred galaxies. The dashed line represents the ℛ distribution taking into account different values of alpha and beta for barred galaxies. The vertical line in both graphs represents the median of the barred sample.
Current usage metrics show cumulative count of Article Views (full-text article views including HTML views, PDF and ePub downloads, according to the available data) and Abstracts Views on Vision4Press platform.
Data correspond to usage on the plateform after 2015. The current usage metrics is available 48-96 hours after online publication and is updated daily on week days.
Initial download of the metrics may take a while.