Open Access
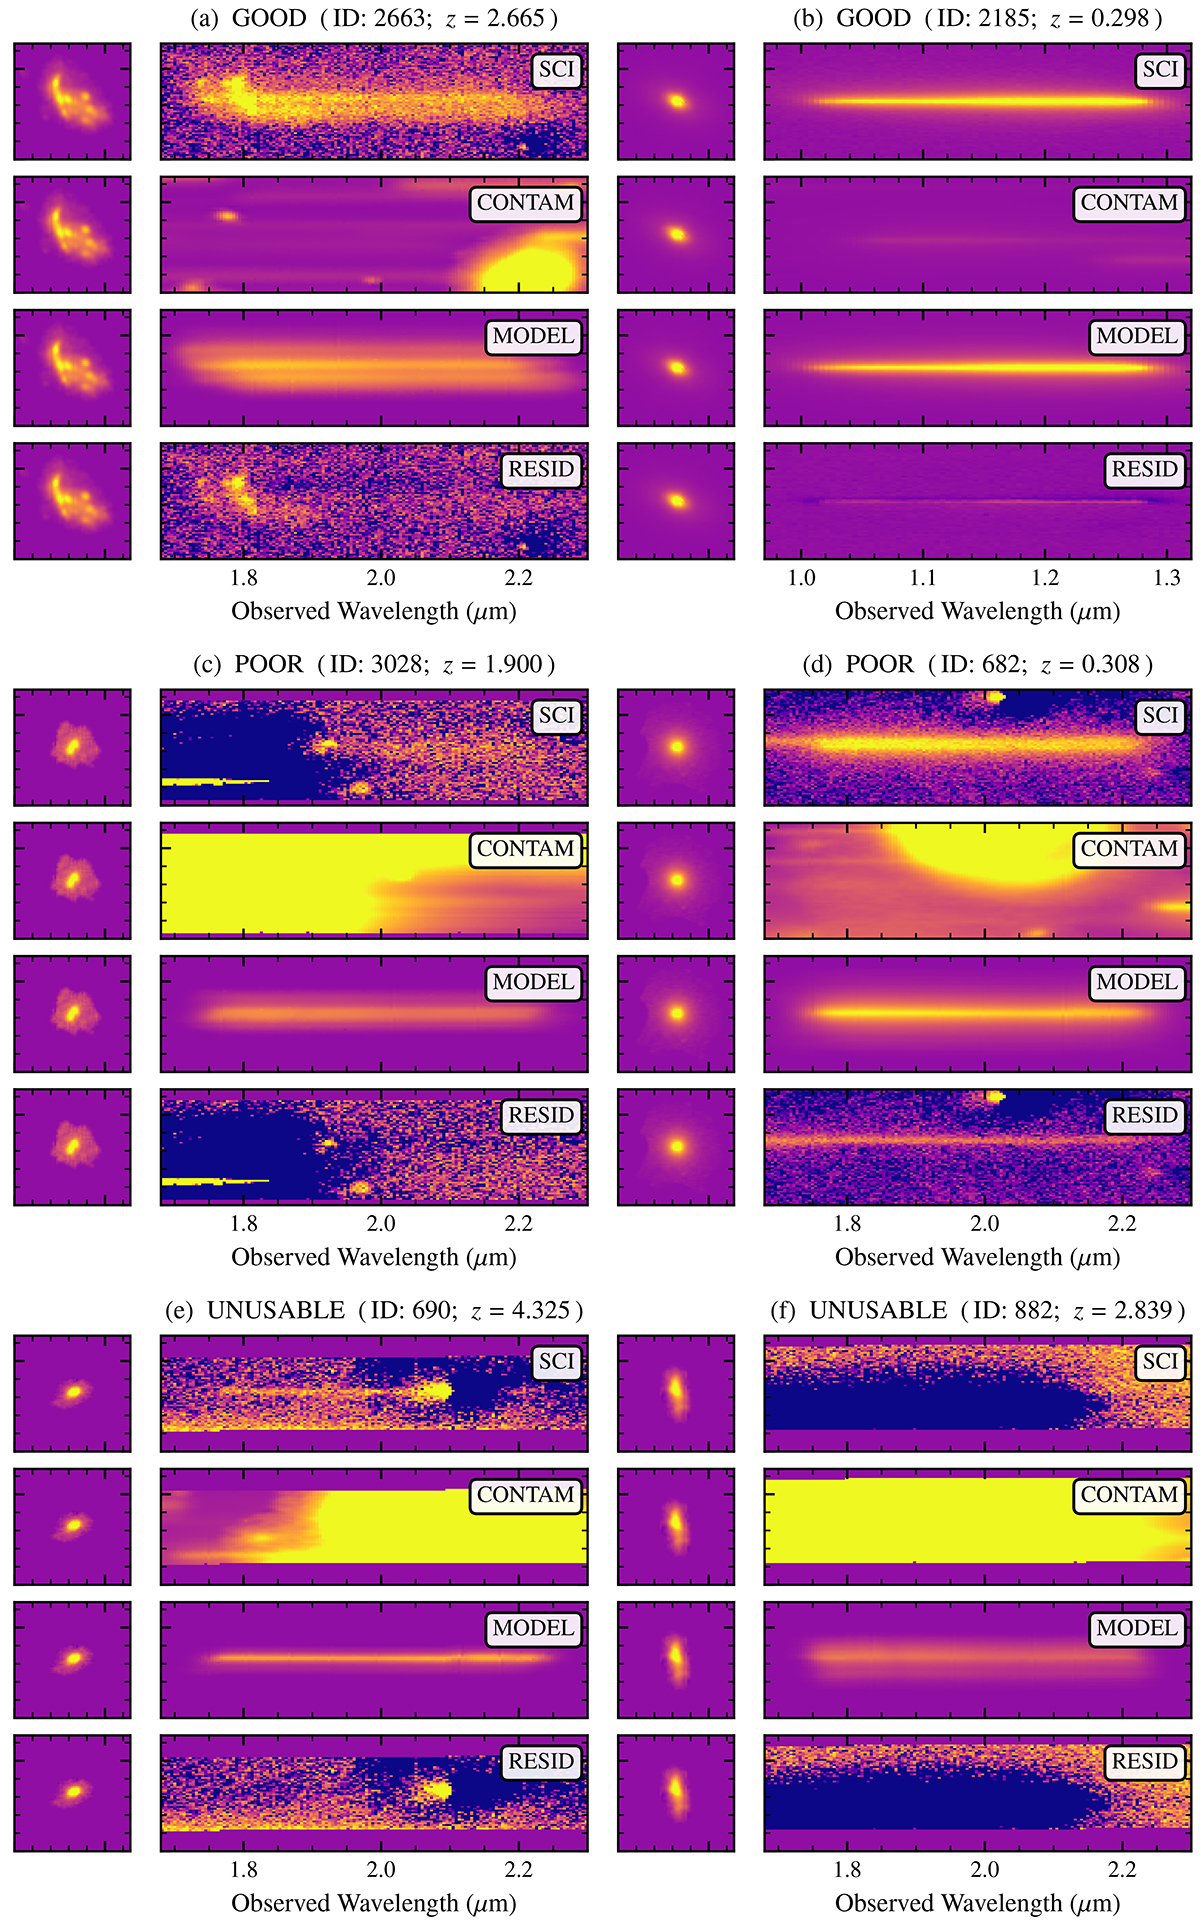
Fig. C.1.
Download original image
Examples of the various beam quality flags. For each object we display the direct image in the relevant filter on the left, alongside (from top to bottom), the contamination-subtracted 2D spectrum, the contaminating flux, the best-fit continuum model, and the residual after continuum subtraction.
Current usage metrics show cumulative count of Article Views (full-text article views including HTML views, PDF and ePub downloads, according to the available data) and Abstracts Views on Vision4Press platform.
Data correspond to usage on the plateform after 2015. The current usage metrics is available 48-96 hours after online publication and is updated daily on week days.
Initial download of the metrics may take a while.