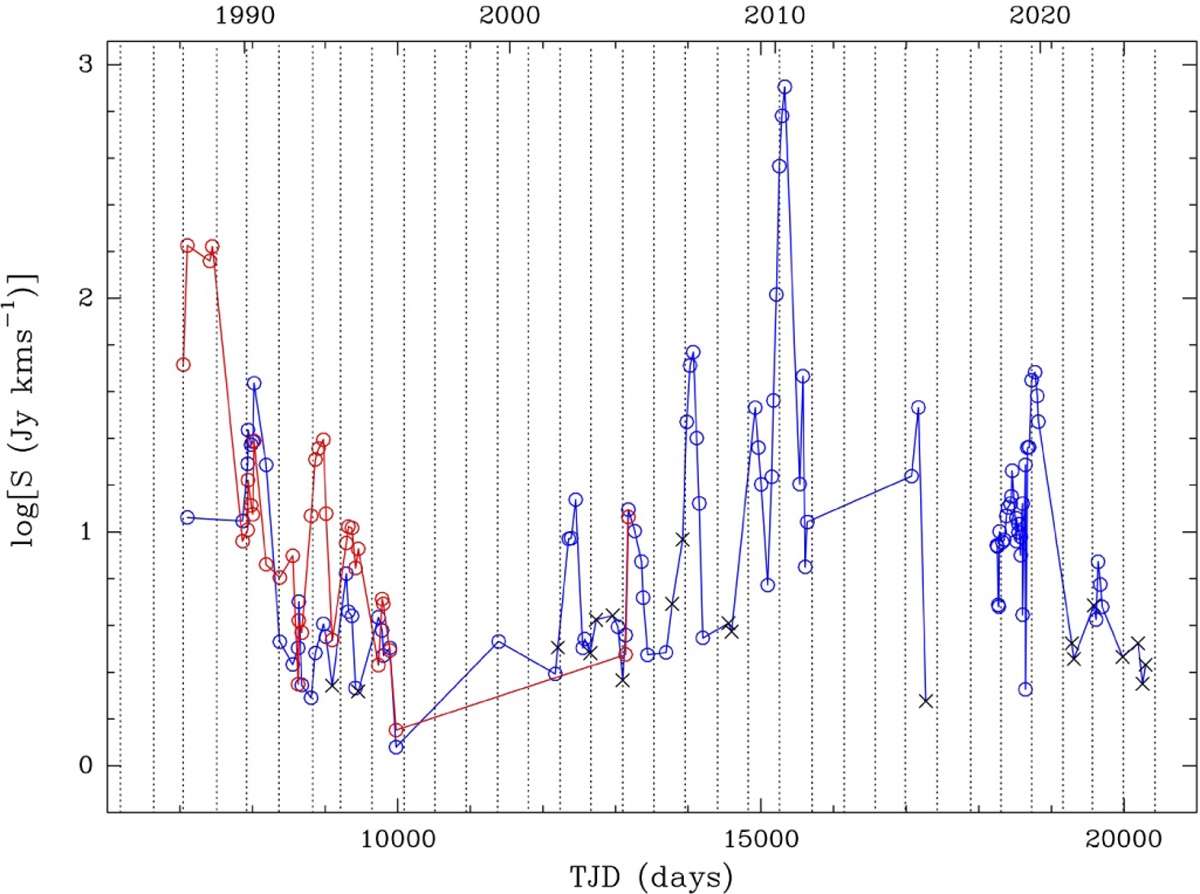
Fig. 9
Download original image
Logarithm of the velocity-integrated flux of water-masers in R Cas, which is derived from the area under Gaussian fits to maser main emission components versus time: ~24.5 kms−1 (blue) and ~27.5 km s−1 (red), respectively. Where the emission line in question has a signal-to-noise ratio lower than 3, the data point is marked with a black cross. When detected, both components demonstrate the same trend in their flux density with time. The vertical dotted lines indicate the star’s visual maxima (AAVSO data).
Current usage metrics show cumulative count of Article Views (full-text article views including HTML views, PDF and ePub downloads, according to the available data) and Abstracts Views on Vision4Press platform.
Data correspond to usage on the plateform after 2015. The current usage metrics is available 48-96 hours after online publication and is updated daily on week days.
Initial download of the metrics may take a while.