Fig. 8
Download original image
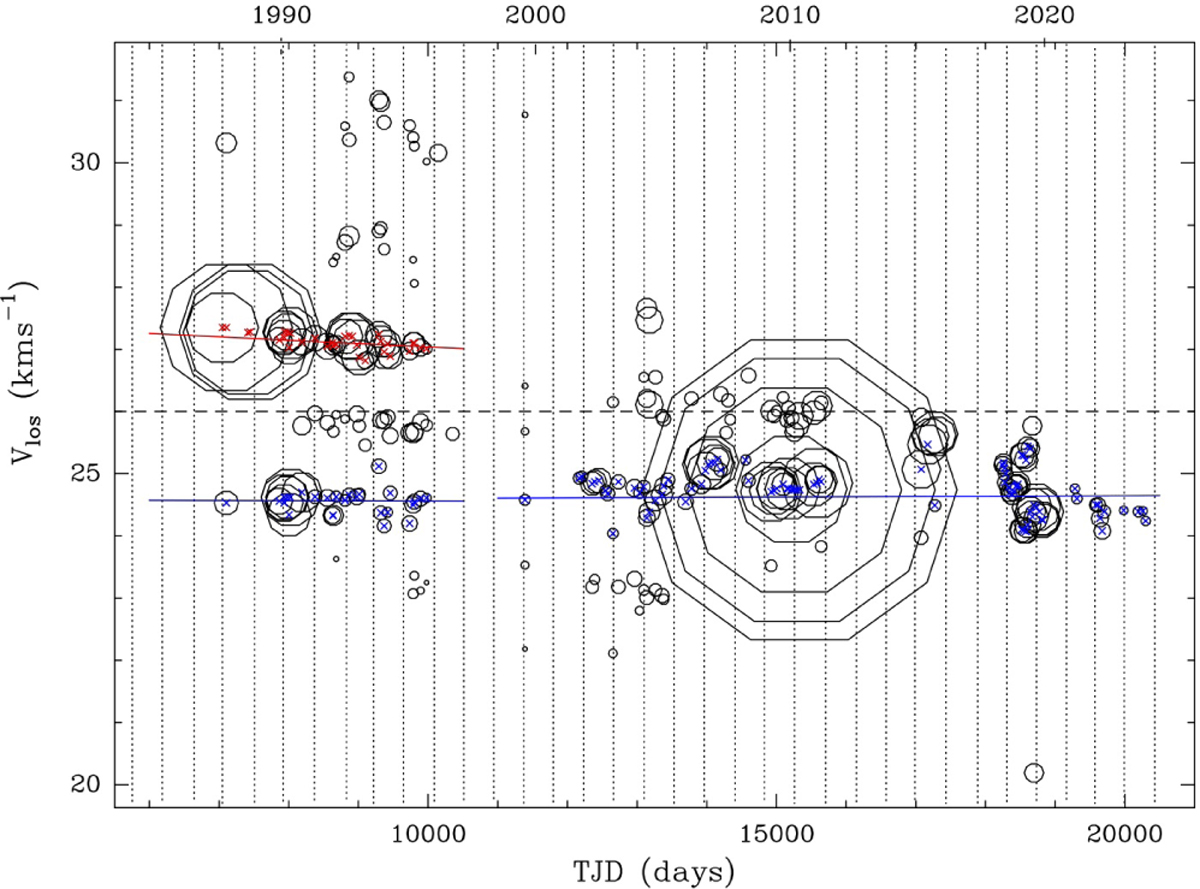
Water-maser components in R Cas, whose peak flux density velocities Vlos from Gaussian fits to maser emission components, are plotted against time. Sizes of the symbols are proportional to the peak flux density of the components. Solid blue and red lines are weighted least-squares fits to the components at ~24.5 kms−1 and ~27.5 km s−1, respectively. Fits are made separately for epochs 1 and 2 (see Fig. 7). Components that participated in the fits are indicated by red (27.5 km s−1 component) or blue (24.5 km s−1 component) crosses. The horizontal dashed line marks the stellar radial velocity V*; the vertical dotted lines indicate the star’s visual maxima (AAVSO data).
Current usage metrics show cumulative count of Article Views (full-text article views including HTML views, PDF and ePub downloads, according to the available data) and Abstracts Views on Vision4Press platform.
Data correspond to usage on the plateform after 2015. The current usage metrics is available 48-96 hours after online publication and is updated daily on week days.
Initial download of the metrics may take a while.