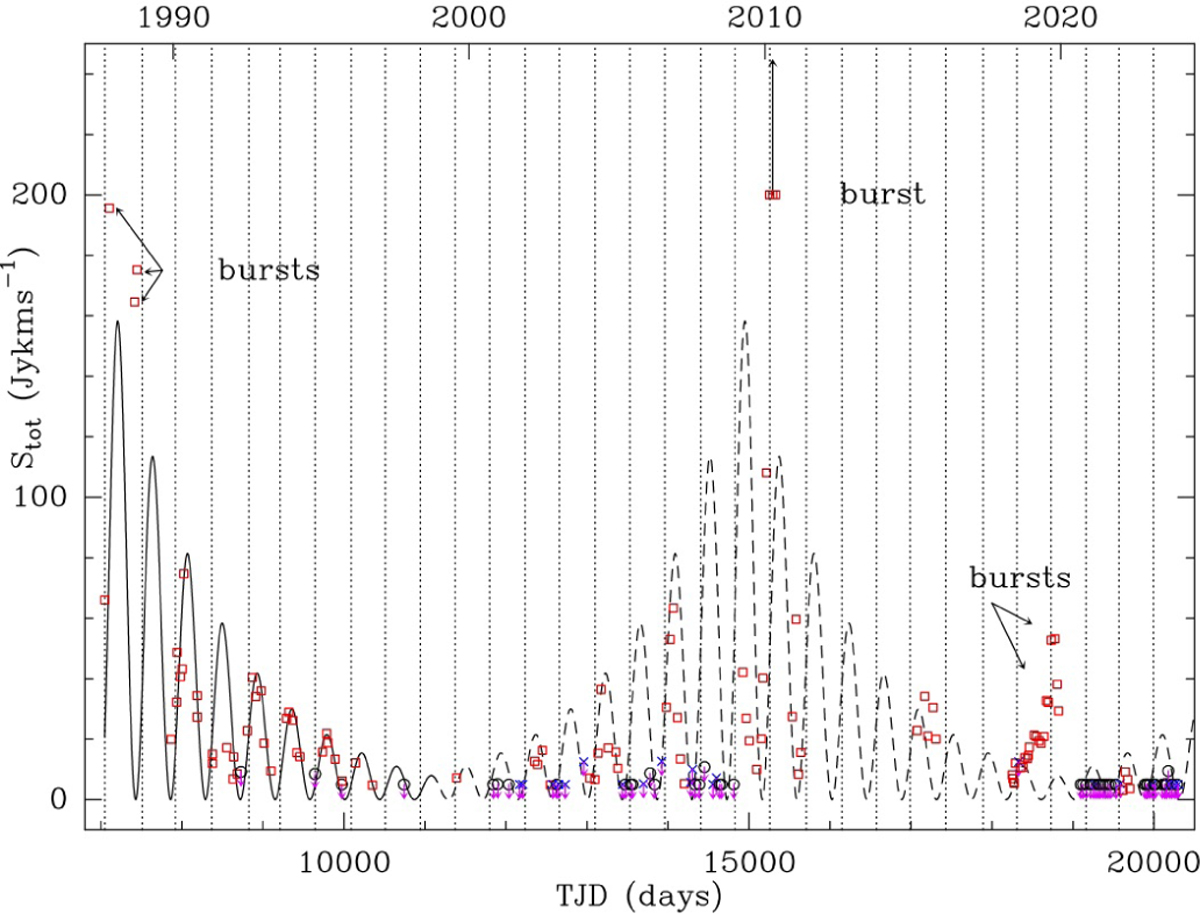
Fig. 7
Download original image
R Cas maser light curve in 1987-2023. The solid curve shows the damped oscillator fit displayed in Fig. 6. The dashed curve between TJD 11 079 and 15 110 is its repetition in reverse direction, while it is repeated in the original direction after TJD 15 110 to show the pattern of repeatability in the data. See the text for discussion. The three observations near TJD 15 000, indicated with an upward arrow, were made over 74 days and have Stot of 372, 611, and 814 Jy km s−1, respectively; they are part of a burst that lasted at least 4 months. The vertical dotted lines indicate the visual maxima of the star (AAVSO data). We distinguish between detections (red squares), non-detections (grey circles) and marginal detections (blue crosses). Based on the pattern in the brightness variations we refer to the intervals ~1987-1997 and ~1999-2019 as ‘epoch 1’ and ‘epoch 2’, respectively (see text Sect. 4.3).
Current usage metrics show cumulative count of Article Views (full-text article views including HTML views, PDF and ePub downloads, according to the available data) and Abstracts Views on Vision4Press platform.
Data correspond to usage on the plateform after 2015. The current usage metrics is available 48-96 hours after online publication and is updated daily on week days.
Initial download of the metrics may take a while.