Fig. 6
Download original image
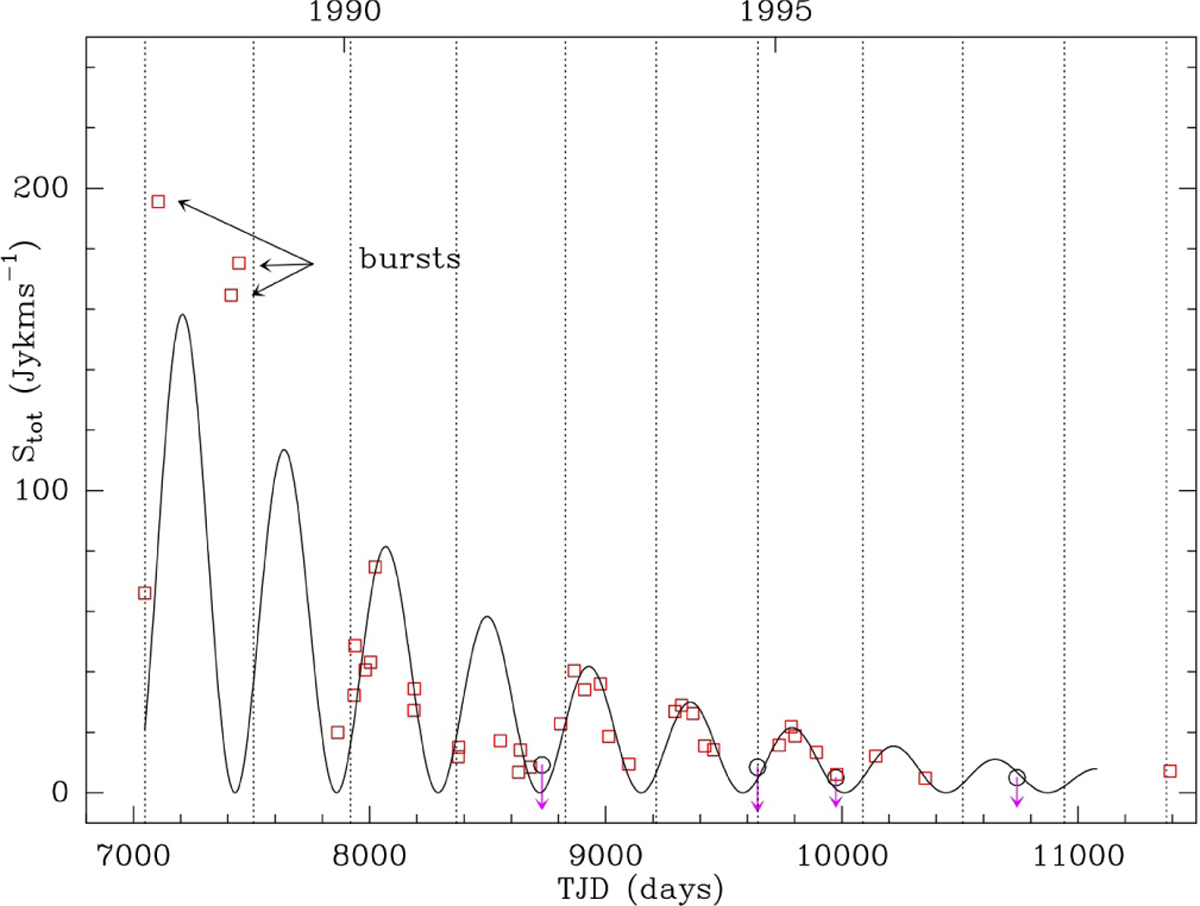
R Cas H2O-maser light curve 1987-1999 displayed in integrated fluxes vs. TJD. The red squares denote detections; the black circles denote non detections; downward arrows indicate upper limits in those cases. The drawn curve shows a damped oscillator fitted to the data and has a period of 430 ± 4 days, very similar to the stellar period of visual variation, the location of the maxima of which are indicated by the dotted vertical lines (visual magnitudes; AAVSO-data).
Current usage metrics show cumulative count of Article Views (full-text article views including HTML views, PDF and ePub downloads, according to the available data) and Abstracts Views on Vision4Press platform.
Data correspond to usage on the plateform after 2015. The current usage metrics is available 48-96 hours after online publication and is updated daily on week days.
Initial download of the metrics may take a while.