Open Access
Fig. 23
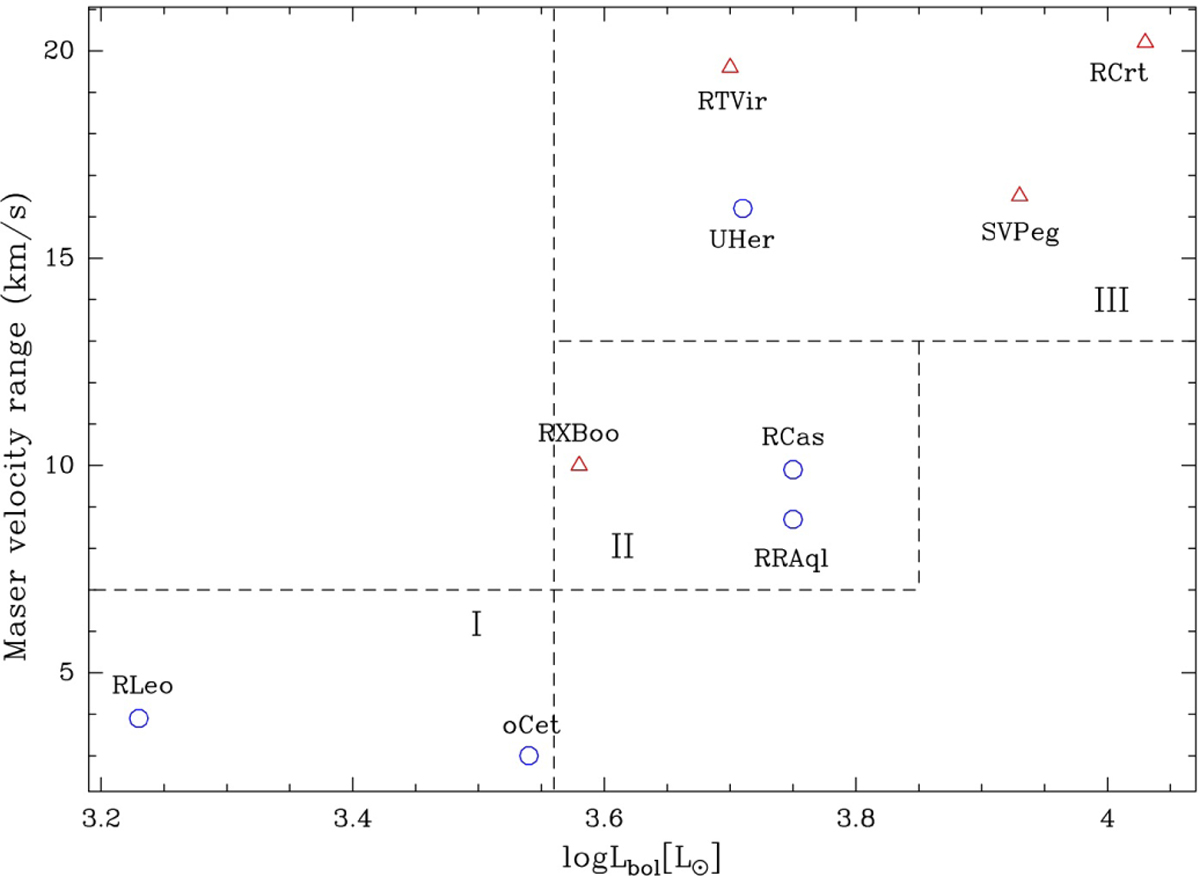
Download original image
Velocity range covered by the H2O-maser emission vs. bolometric luminosity for the stars discussed in the current paper and in papers I-III. The red triangles and blue circles indicate SRVs and Miras, respectively. The dashed lines mark regions (I-III) for sources whose properties might be different.
Current usage metrics show cumulative count of Article Views (full-text article views including HTML views, PDF and ePub downloads, according to the available data) and Abstracts Views on Vision4Press platform.
Data correspond to usage on the plateform after 2015. The current usage metrics is available 48-96 hours after online publication and is updated daily on week days.
Initial download of the metrics may take a while.