Open Access
Fig. 22
Download original image
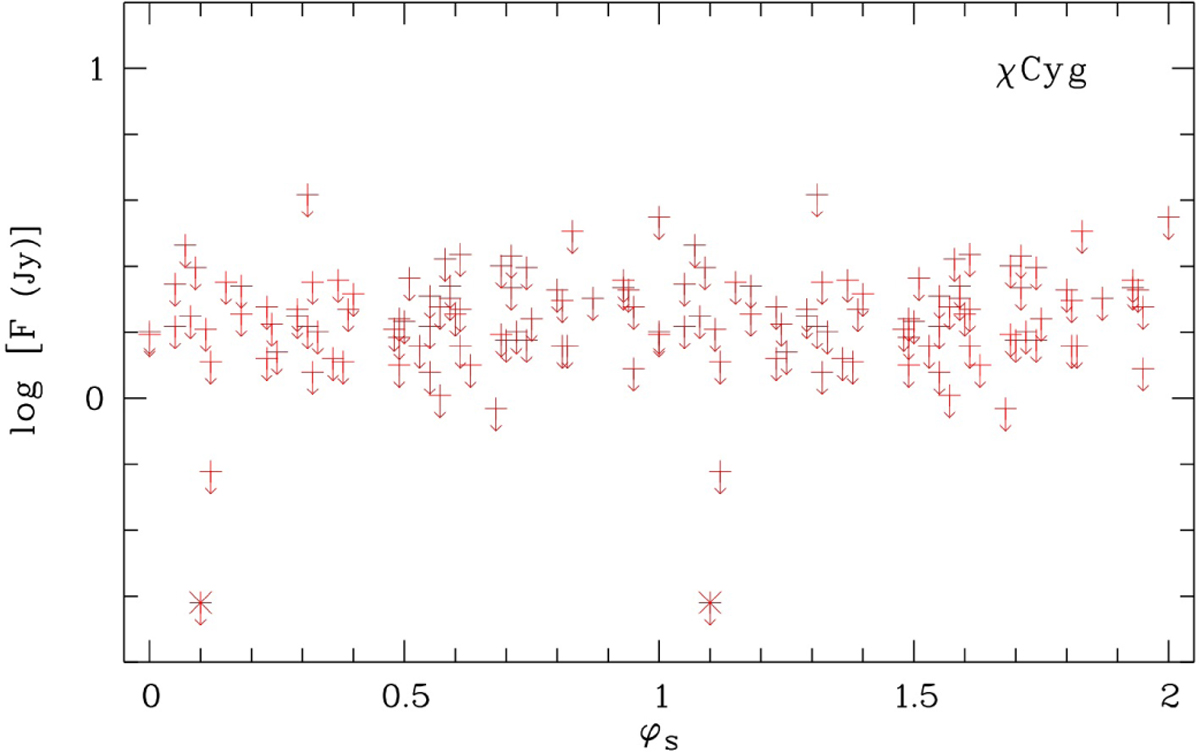
χ Cyg H2O-maser observations between September 1995 and June 2009. The data point marked by an asterisk is from Effelsberg, the plusses are Medicina data. We plot the 3σ flux density upper limits, where σ is the noise of the spectra. There are no detections.
Current usage metrics show cumulative count of Article Views (full-text article views including HTML views, PDF and ePub downloads, according to the available data) and Abstracts Views on Vision4Press platform.
Data correspond to usage on the plateform after 2015. The current usage metrics is available 48-96 hours after online publication and is updated daily on week days.
Initial download of the metrics may take a while.