Fig. 2
Download original image
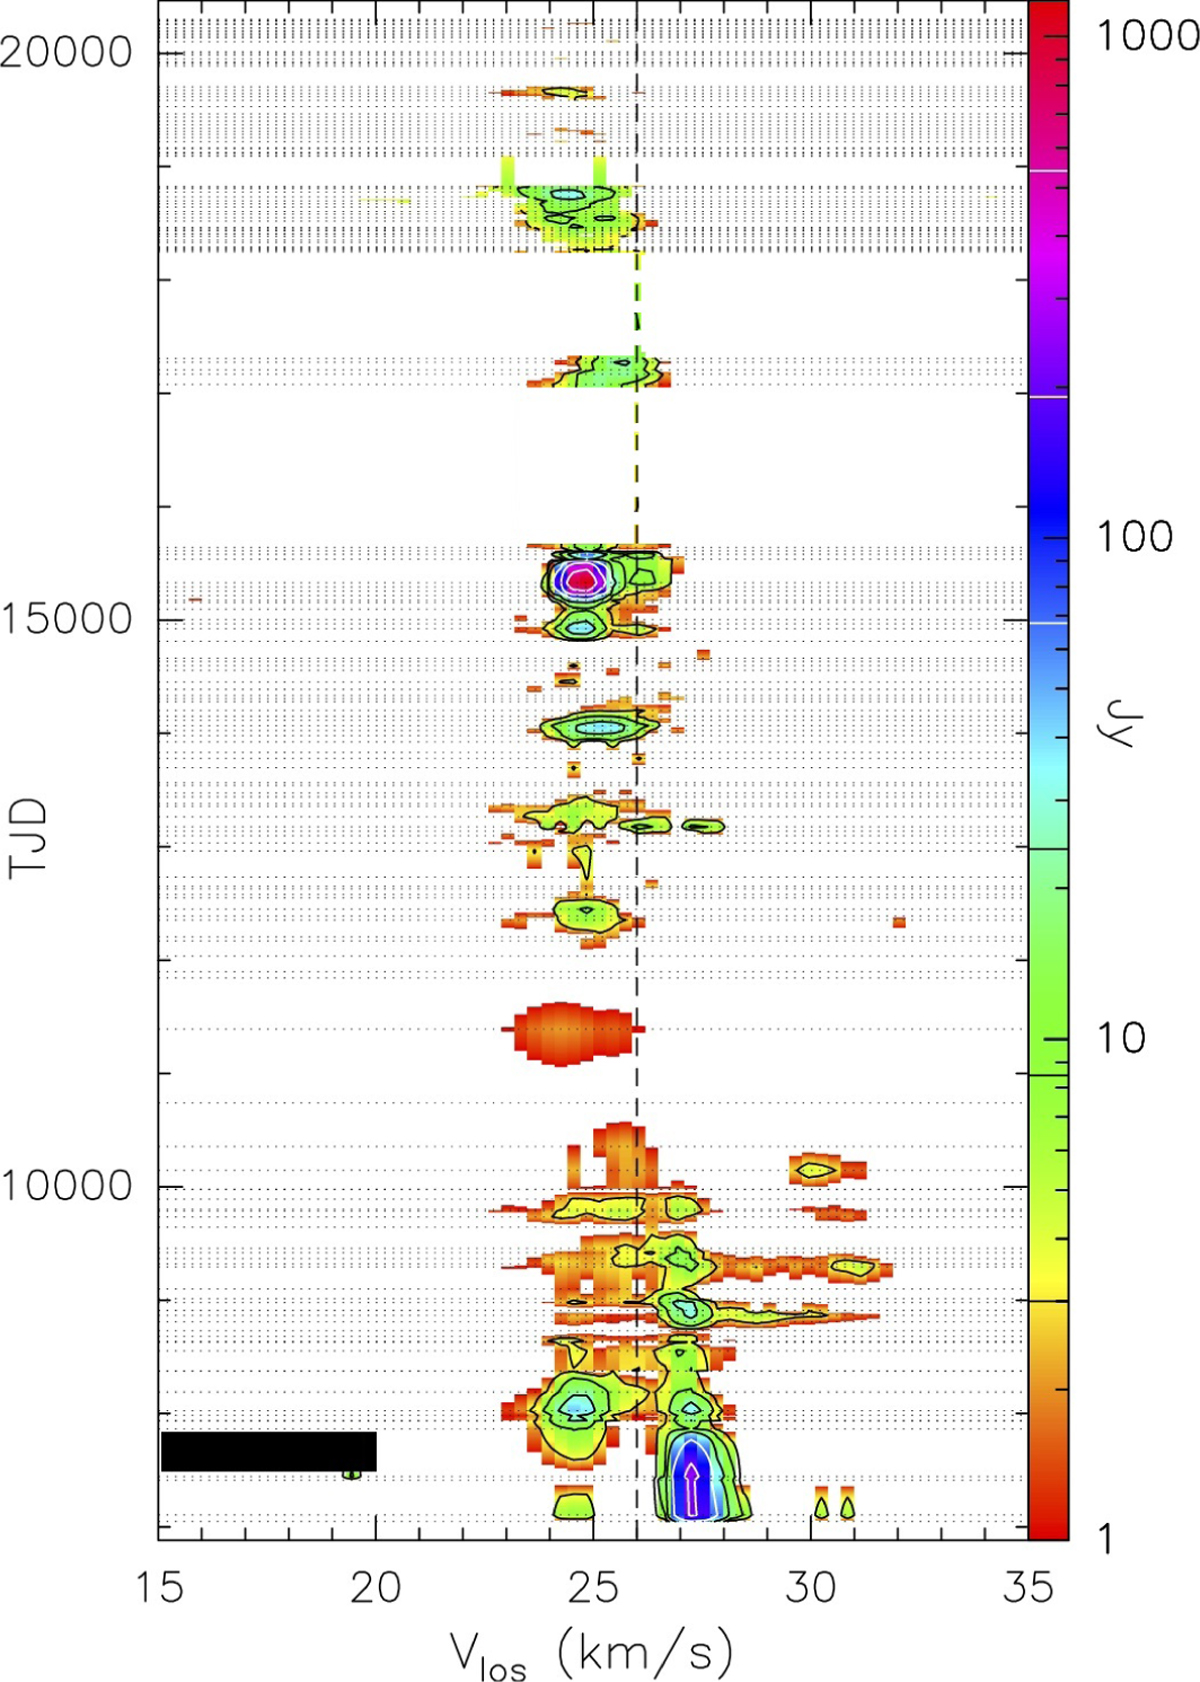
Flux density vs. line-of-sight velocity Vlos as a function of time (FVt-plot) for water-masers in R Cas. Each horizontal dotted line indicates an observation (spectra taken within 4 days from each other were averaged). The data were resampled to a resolution of 0.3 km s−1 and only emission at levels ≥3σ is shown. The black area in the plot indicates the unobserved parts of the spectrum on these particular days. The first spectrum in this plot was taken on 10 September 1987; JD = 2447048.5, TJD = JD-2440000.5 = 7048. The last spectrum in the panel is from 21 December 2023.
Current usage metrics show cumulative count of Article Views (full-text article views including HTML views, PDF and ePub downloads, according to the available data) and Abstracts Views on Vision4Press platform.
Data correspond to usage on the plateform after 2015. The current usage metrics is available 48-96 hours after online publication and is updated daily on week days.
Initial download of the metrics may take a while.