Open Access
Fig. 18
Download original image
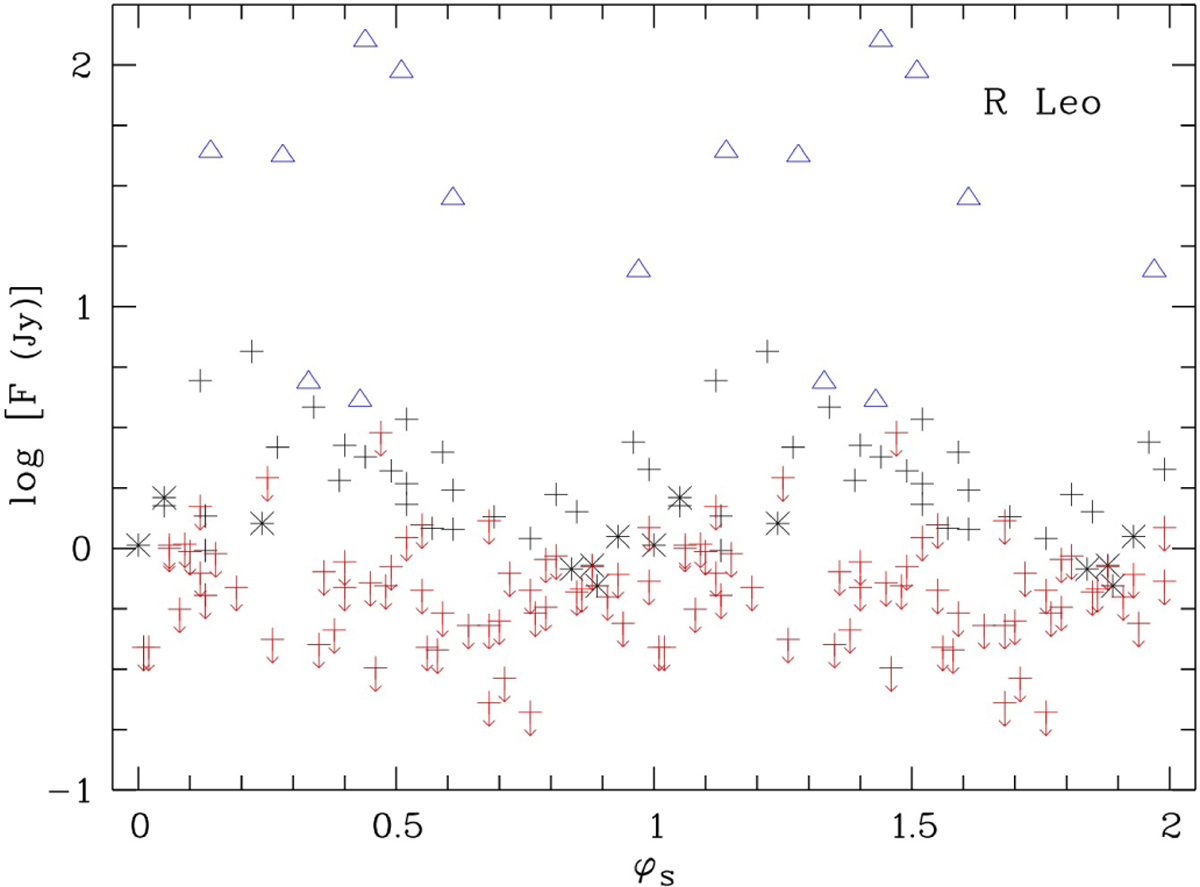
R Leo H2O-maser light curve in 1995-2011. We plot the peak flux densities (from the line fit) vs. optical phase φs. For better visualisation, the data are repeated for a second period. The blue triangles belong to the burst period (see Fig. 17).
Current usage metrics show cumulative count of Article Views (full-text article views including HTML views, PDF and ePub downloads, according to the available data) and Abstracts Views on Vision4Press platform.
Data correspond to usage on the plateform after 2015. The current usage metrics is available 48-96 hours after online publication and is updated daily on week days.
Initial download of the metrics may take a while.