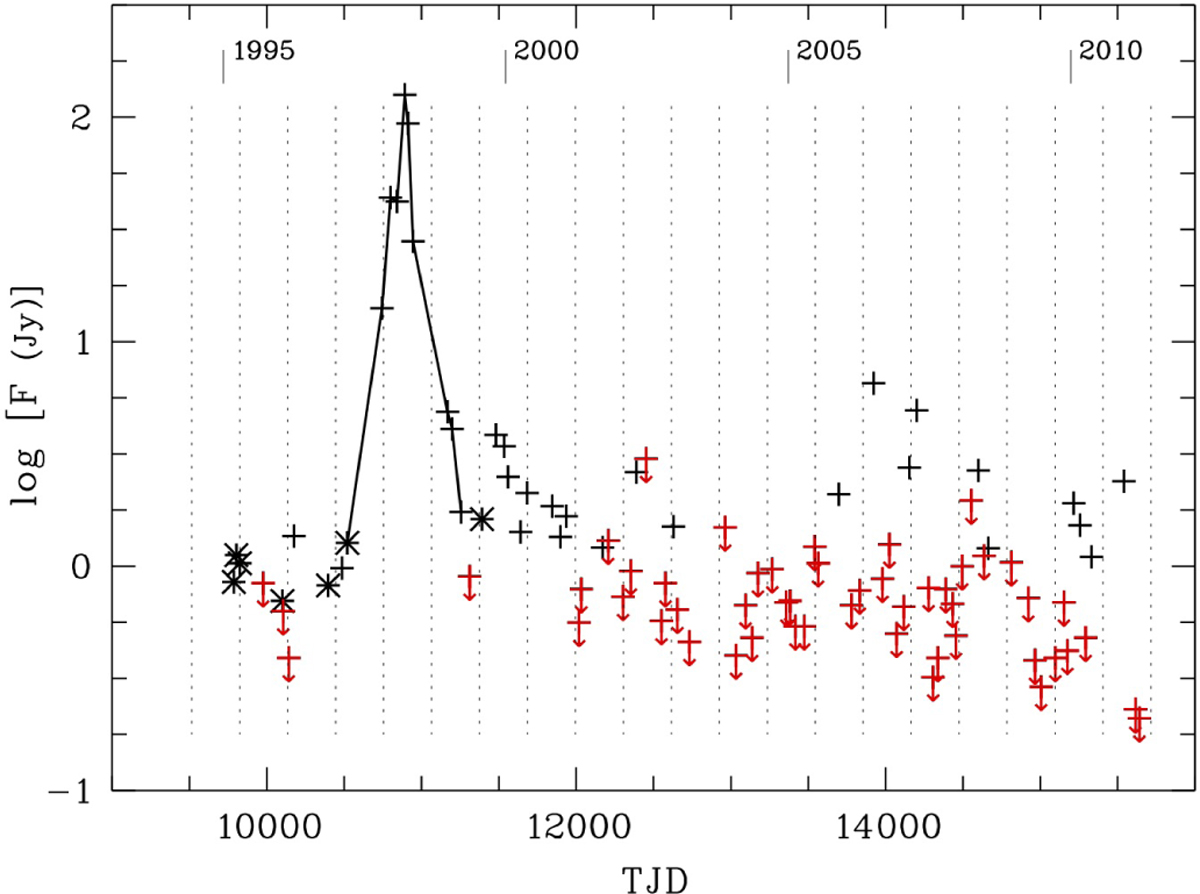
Fig. 17
Download original image
R Leo H2O-maser light curve in 1995-2011. We display the flux densities obtained from the line fit features seen between -2 and +2 km s−1 (see text) vs. TJD. Data points marked by an asterisk are from Effelsberg and plusses are from Medicina data. Upper limits are shown as downward arrows in red. Times of maximum optical brightness defined by the sine wave fit to the optical data are indicated by dotted lines. Observations during the burst in 1997-1999 (TJD - 11 000) are connected by solid lines.
Current usage metrics show cumulative count of Article Views (full-text article views including HTML views, PDF and ePub downloads, according to the available data) and Abstracts Views on Vision4Press platform.
Data correspond to usage on the plateform after 2015. The current usage metrics is available 48-96 hours after online publication and is updated daily on week days.
Initial download of the metrics may take a while.