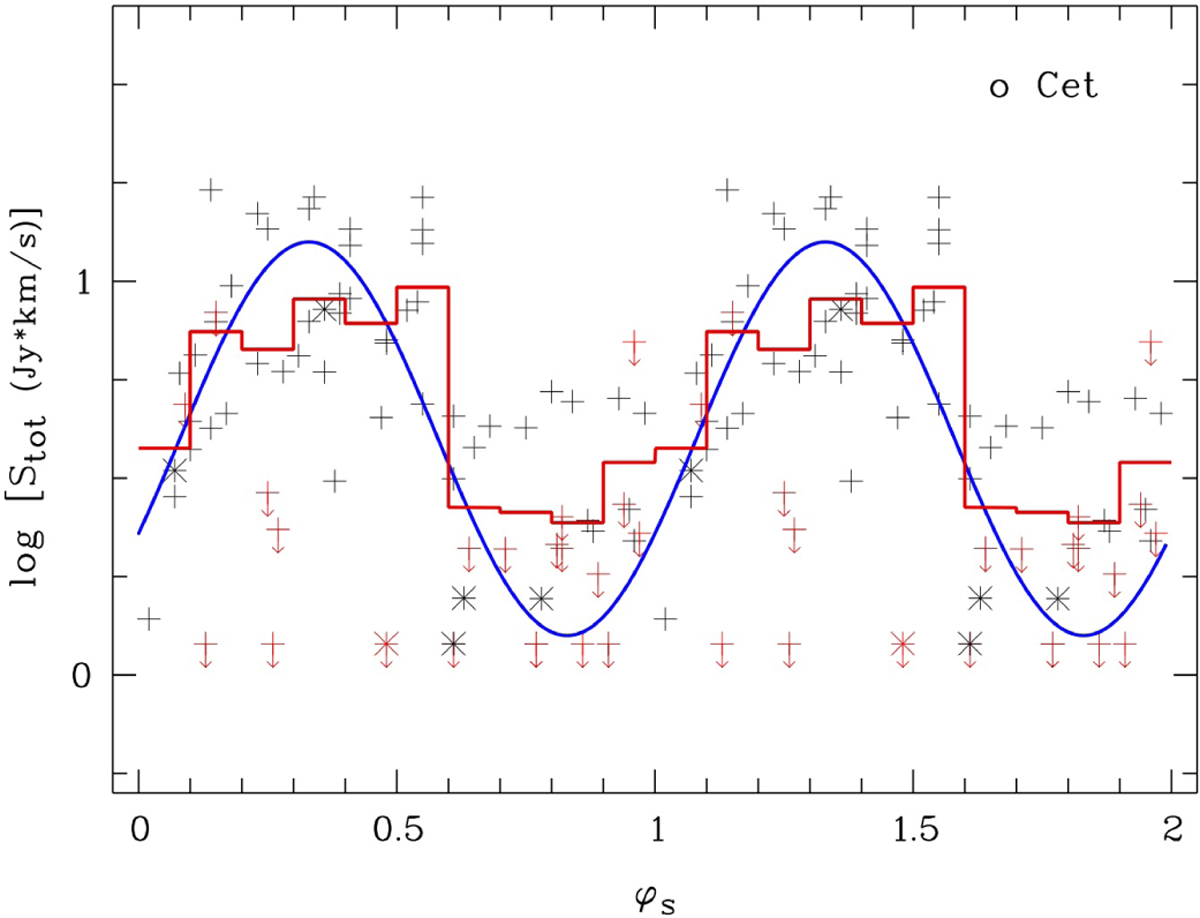
Fig. 14
Download original image
o Cet H2O-maser light curve in 1995-2011. We plot the total fluxes Stot vs. optical phase φs. For better visualisation, the data are repeated for a second period and binned in phase intervals with a width of 0.1 (red step function). φs=0 is defined as the time of maximum optical brightness. The data points marked by an asterisk are from Effelsberg, and the plusses are from Medicina data. Upper limits are shown as downward arrows in red. The sine curve (blue) was obtained by a fit to the 1995-2011 radio measurements with a period Popt = 332 days, and it is delayed by ϕ1ag = 0.33, that is, by 110 days.
Current usage metrics show cumulative count of Article Views (full-text article views including HTML views, PDF and ePub downloads, according to the available data) and Abstracts Views on Vision4Press platform.
Data correspond to usage on the plateform after 2015. The current usage metrics is available 48-96 hours after online publication and is updated daily on week days.
Initial download of the metrics may take a while.