Open Access
Fig. A.4
Download original image
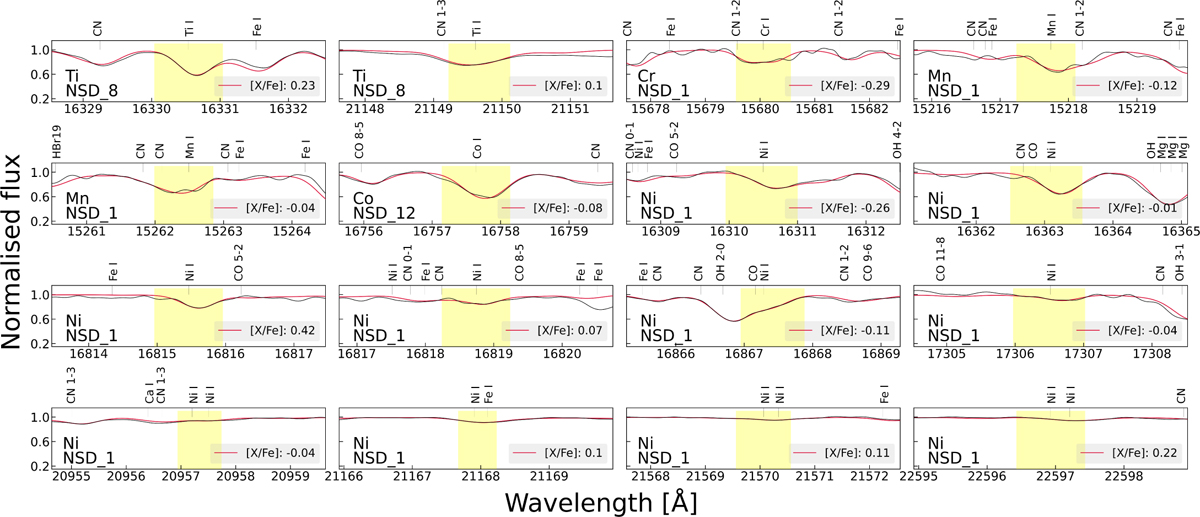
Sample spectra of the NSD stars NSD_1, NSD_8, and NSD_12 with wavelength regions centred at the individual absorption lines of the iron-peak elements – Ti, Cr, Mn, Co, and K. The arrangement of panels and descriptions are similar to Fig. A.1.
Current usage metrics show cumulative count of Article Views (full-text article views including HTML views, PDF and ePub downloads, according to the available data) and Abstracts Views on Vision4Press platform.
Data correspond to usage on the plateform after 2015. The current usage metrics is available 48-96 hours after online publication and is updated daily on week days.
Initial download of the metrics may take a while.