Fig. A.1
Download original image
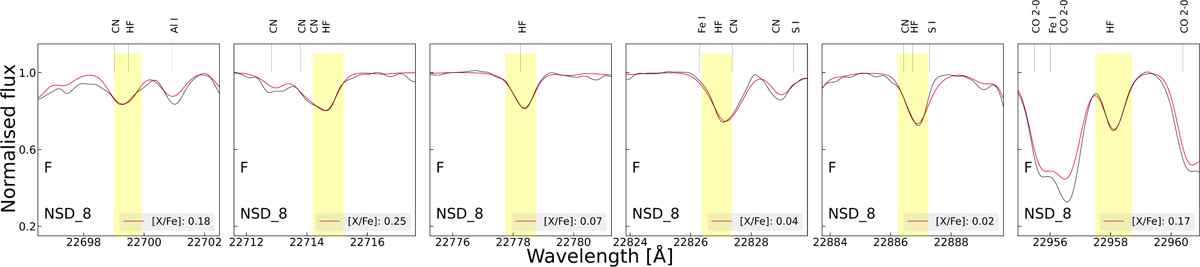
Sample spectra of the NSD star NSD_8 with wavelength regions centred at the individual absorption lines of fluorine. The black line in each panel denotes the observed spectrum, the crimson line the best-fit synthetic spectrum, and the yellow bands the line masks defined for each absorption line. The abundances corresponding to the best-fit case for each line are listed in every panel, and all identified atomic and molecular lines are provided at the top of each panel.
Current usage metrics show cumulative count of Article Views (full-text article views including HTML views, PDF and ePub downloads, according to the available data) and Abstracts Views on Vision4Press platform.
Data correspond to usage on the plateform after 2015. The current usage metrics is available 48-96 hours after online publication and is updated daily on week days.
Initial download of the metrics may take a while.