Fig. 1
Download original image
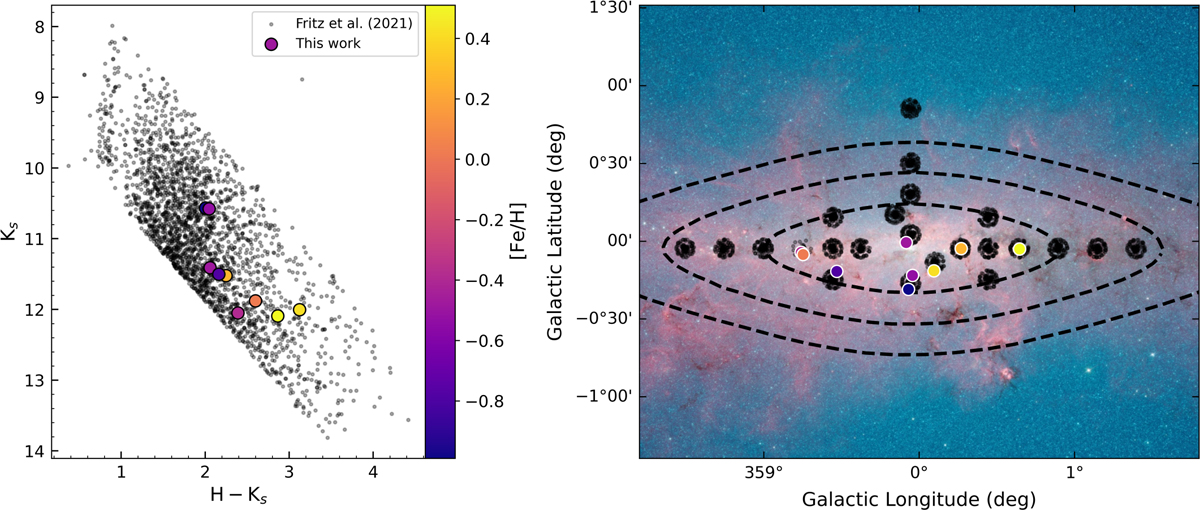
Left: Ks vs. (H-Ks) diagram of our targets, coloured by metallicity, superimposed on stars from the Fritz et al. (2021) KMOS catalogue. Right: distribution of our targets in the sky as coloured circles, again coloured by metallicity. Dashed black lines show the density contours of the NSD model from Sormani et al. (2022) over an image from the GLIMPSE survey (Benjamin et al. 2003; Glimpse Team 2020). Black dots represent the sample from Fritz et al. (2021).
Current usage metrics show cumulative count of Article Views (full-text article views including HTML views, PDF and ePub downloads, according to the available data) and Abstracts Views on Vision4Press platform.
Data correspond to usage on the plateform after 2015. The current usage metrics is available 48-96 hours after online publication and is updated daily on week days.
Initial download of the metrics may take a while.