Fig. 3.
Download original image
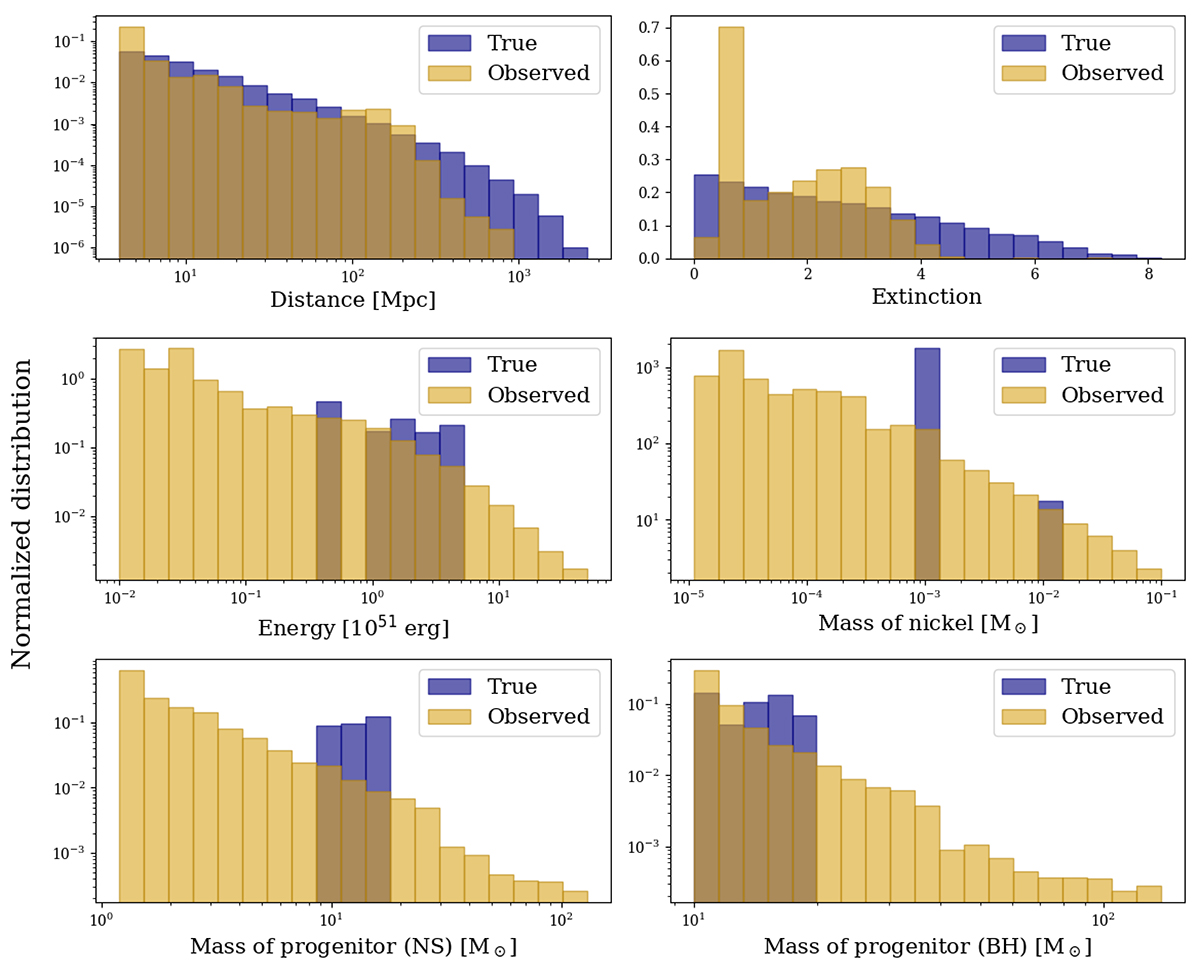
Comparison between the true (dark blue) and the observed (gold) distribution for each estimated parameter. Except for the extinction one, every plot is log scaled and the distributions are binned logarithmically. The normalization (y axes) changes for each distribution. Note that, because the bins are logarithmically distributed, the density is estimated differently for each bin.
Current usage metrics show cumulative count of Article Views (full-text article views including HTML views, PDF and ePub downloads, according to the available data) and Abstracts Views on Vision4Press platform.
Data correspond to usage on the plateform after 2015. The current usage metrics is available 48-96 hours after online publication and is updated daily on week days.
Initial download of the metrics may take a while.