Open Access
Fig. 2
Download original image
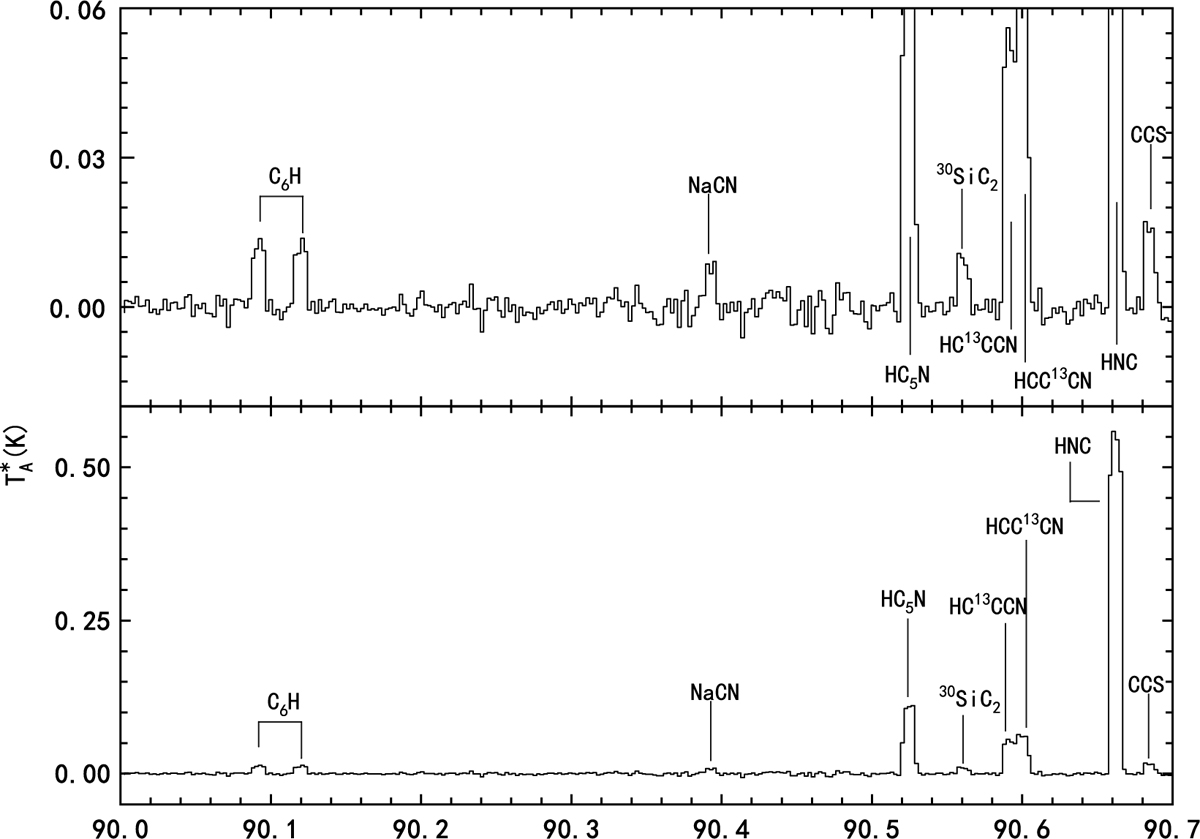
Zoom-in spectra of IRC+10216 with all detected lines labeled. To provide a clearer visualization, the spectra have been smoothed to a resolution of 3 MHz. “SL” denotes that the spectral feature arises from sideband leakage rather than a genuine detection. The complete set of spectra is shown in Figure B.1.
Current usage metrics show cumulative count of Article Views (full-text article views including HTML views, PDF and ePub downloads, according to the available data) and Abstracts Views on Vision4Press platform.
Data correspond to usage on the plateform after 2015. The current usage metrics is available 48-96 hours after online publication and is updated daily on week days.
Initial download of the metrics may take a while.