Fig. A.1.
Download original image
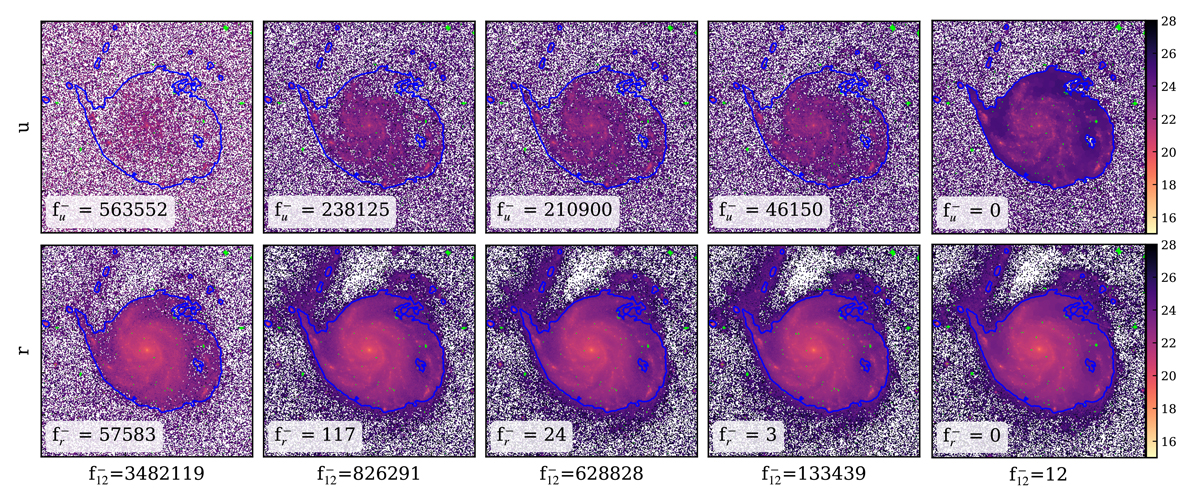
Step-by-step of the preprocessing applied to the J-PLUS data cube of M101. The columns show, respectively: the original data, Butterworth filter, PSF homogenization, 2 × 2 binning, and Voronoi binning (defined by the u-band). The blue line represents the contour of the galaxy mask. The first and second rows are the surface brightness maps (in AB mag/arcsec2) in the u and r-band respectively. Pixels with < 0 flux appear in white. The legends fu− and fr− show the number of pixels with negative fluxes inside the galaxy mask in the u and r bands, while the f12− numbers under the plots are the sum of the fλ < 0 pixels in all the 12 bands for each of the preprocessing steps. Masked stars are marked in green.
Current usage metrics show cumulative count of Article Views (full-text article views including HTML views, PDF and ePub downloads, according to the available data) and Abstracts Views on Vision4Press platform.
Data correspond to usage on the plateform after 2015. The current usage metrics is available 48-96 hours after online publication and is updated daily on week days.
Initial download of the metrics may take a while.