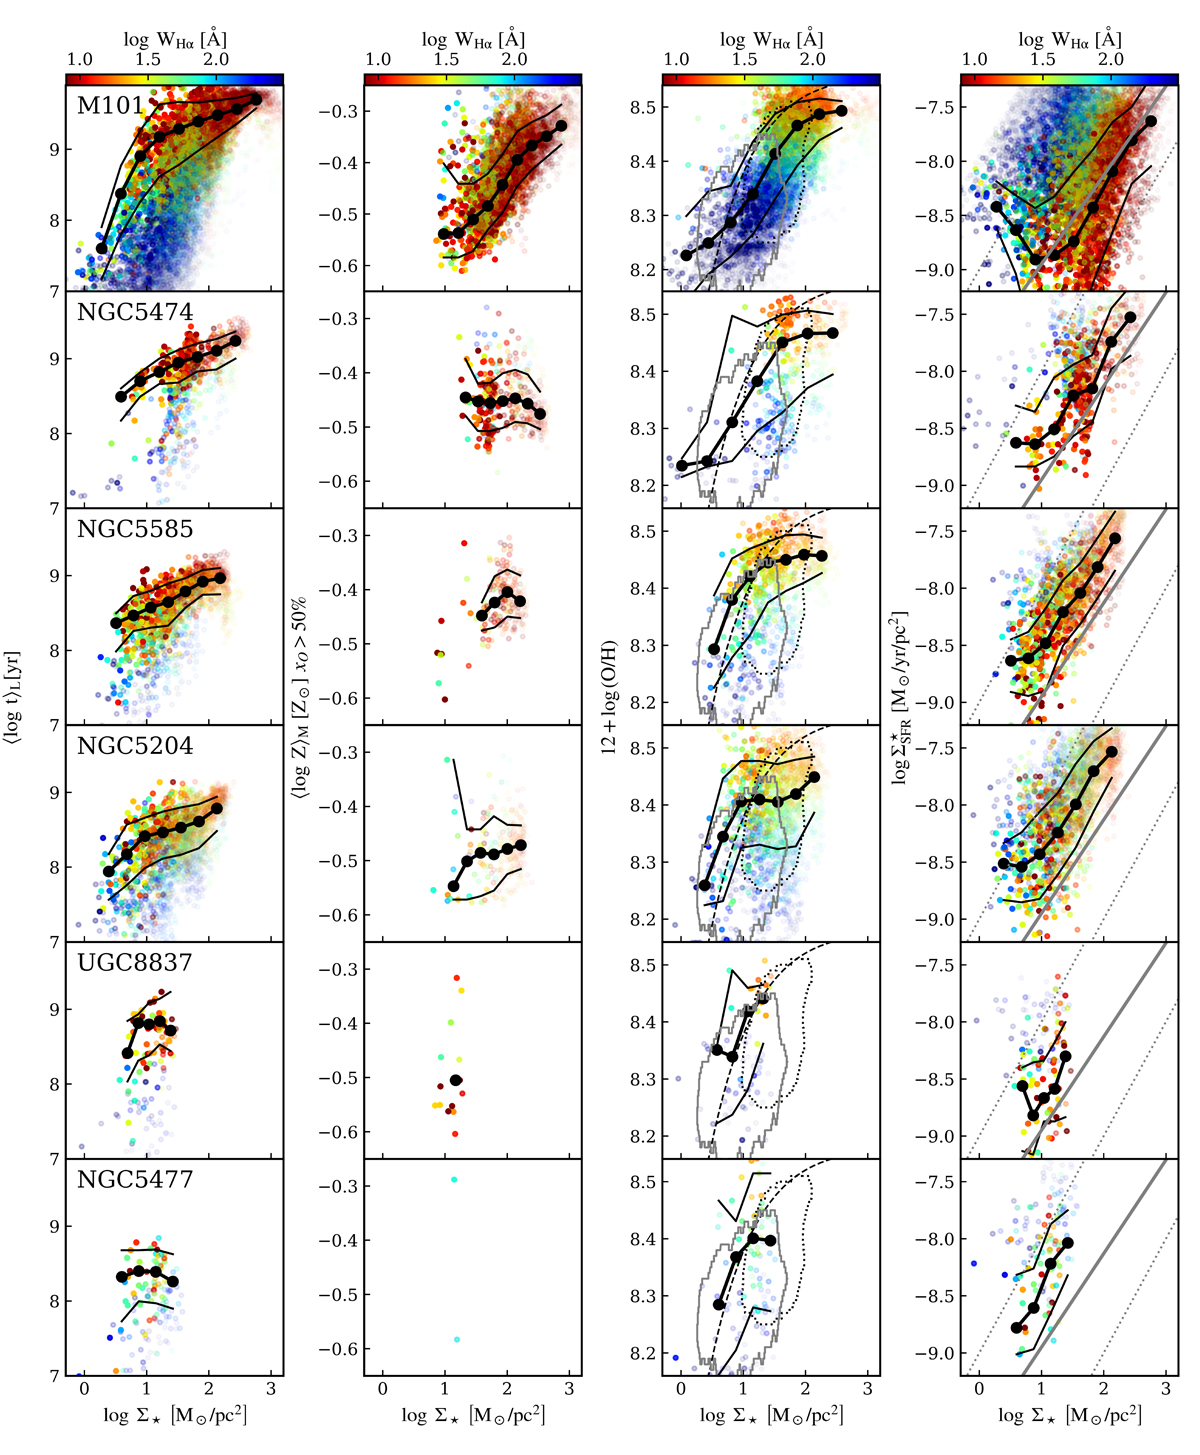
Fig. 5.
Download original image
Scaling relations for galaxies in the M101 group. Individual zones are plotted as circles colored by log WHα. The thick black lines with circle markers indicate the median curves for bins in logΣ⋆; thin lines show the corresponding 16th and 84th percentile curves. In the third column, the black dashed line is the median curve from Barrera-Ballesteros et al. (2016) for 653 MaNGA galaxies. The gray line shows the 80% contour of Barrera-Ballesteros et al. (2016) for MaNGA galaxies with log M⋆/M⊙ < 9.2. The dotted contour indicates the typical loci of Sd galaxies from Sánchez 2020. Dashed lines in the fourth column panels mark lines of specific SFR = 0.01 and 1 Gyr−1. The solid gray line is the relation obtained by Enia et al. (2020) – see text for details.
Current usage metrics show cumulative count of Article Views (full-text article views including HTML views, PDF and ePub downloads, according to the available data) and Abstracts Views on Vision4Press platform.
Data correspond to usage on the plateform after 2015. The current usage metrics is available 48-96 hours after online publication and is updated daily on week days.
Initial download of the metrics may take a while.