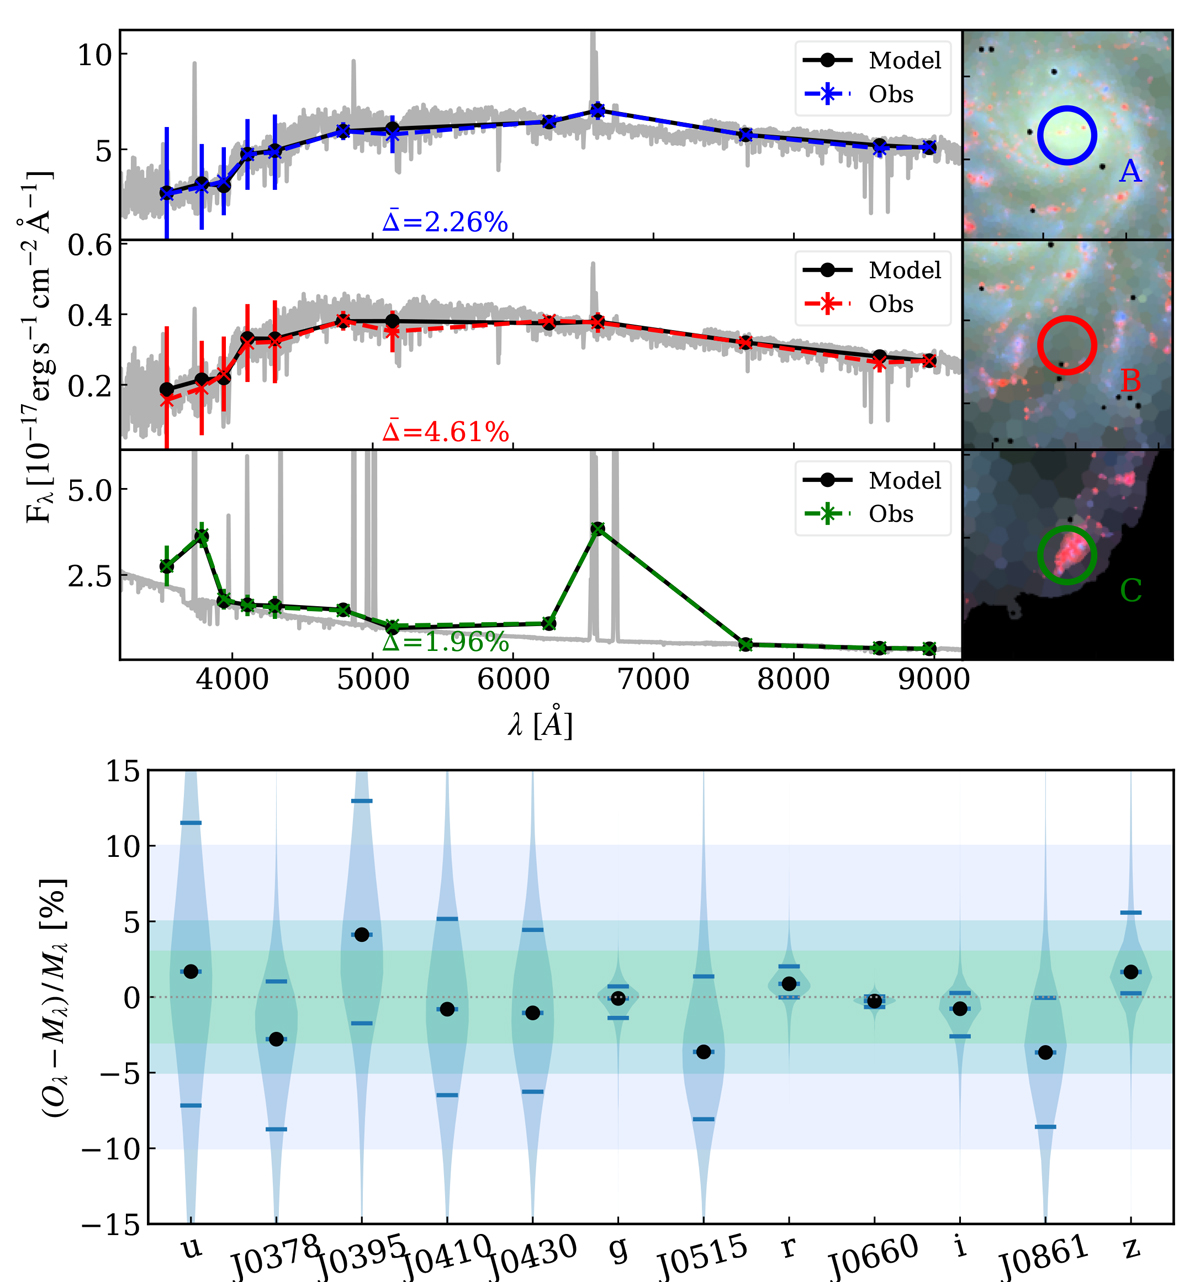
Fig. 2.
Download original image
Top: Example ALSTAR fits for individual spaxels in three different regions of M101. Colored lines with error bars show the data (Oλ), while black lines show the model photometric fluxes (Mλ), and the gray lines show the corresponding high-resolution model spectrum. Images on the right show 278″ × 278″ composites built with the J0660, r, and g fluxes in the R, G, and B channels, respectively. Bottom: Distributions of the (Oλ − Mλ)/Mλ relative residuals of the fits for the 12 J-PLUS bands for 11 705 zones in M101. Median residuals are marked by solid black circles, while the horizontal bars mark the 16 and 84 percentiles.
Current usage metrics show cumulative count of Article Views (full-text article views including HTML views, PDF and ePub downloads, according to the available data) and Abstracts Views on Vision4Press platform.
Data correspond to usage on the plateform after 2015. The current usage metrics is available 48-96 hours after online publication and is updated daily on week days.
Initial download of the metrics may take a while.