Open Access
Fig. 9.
Download original image
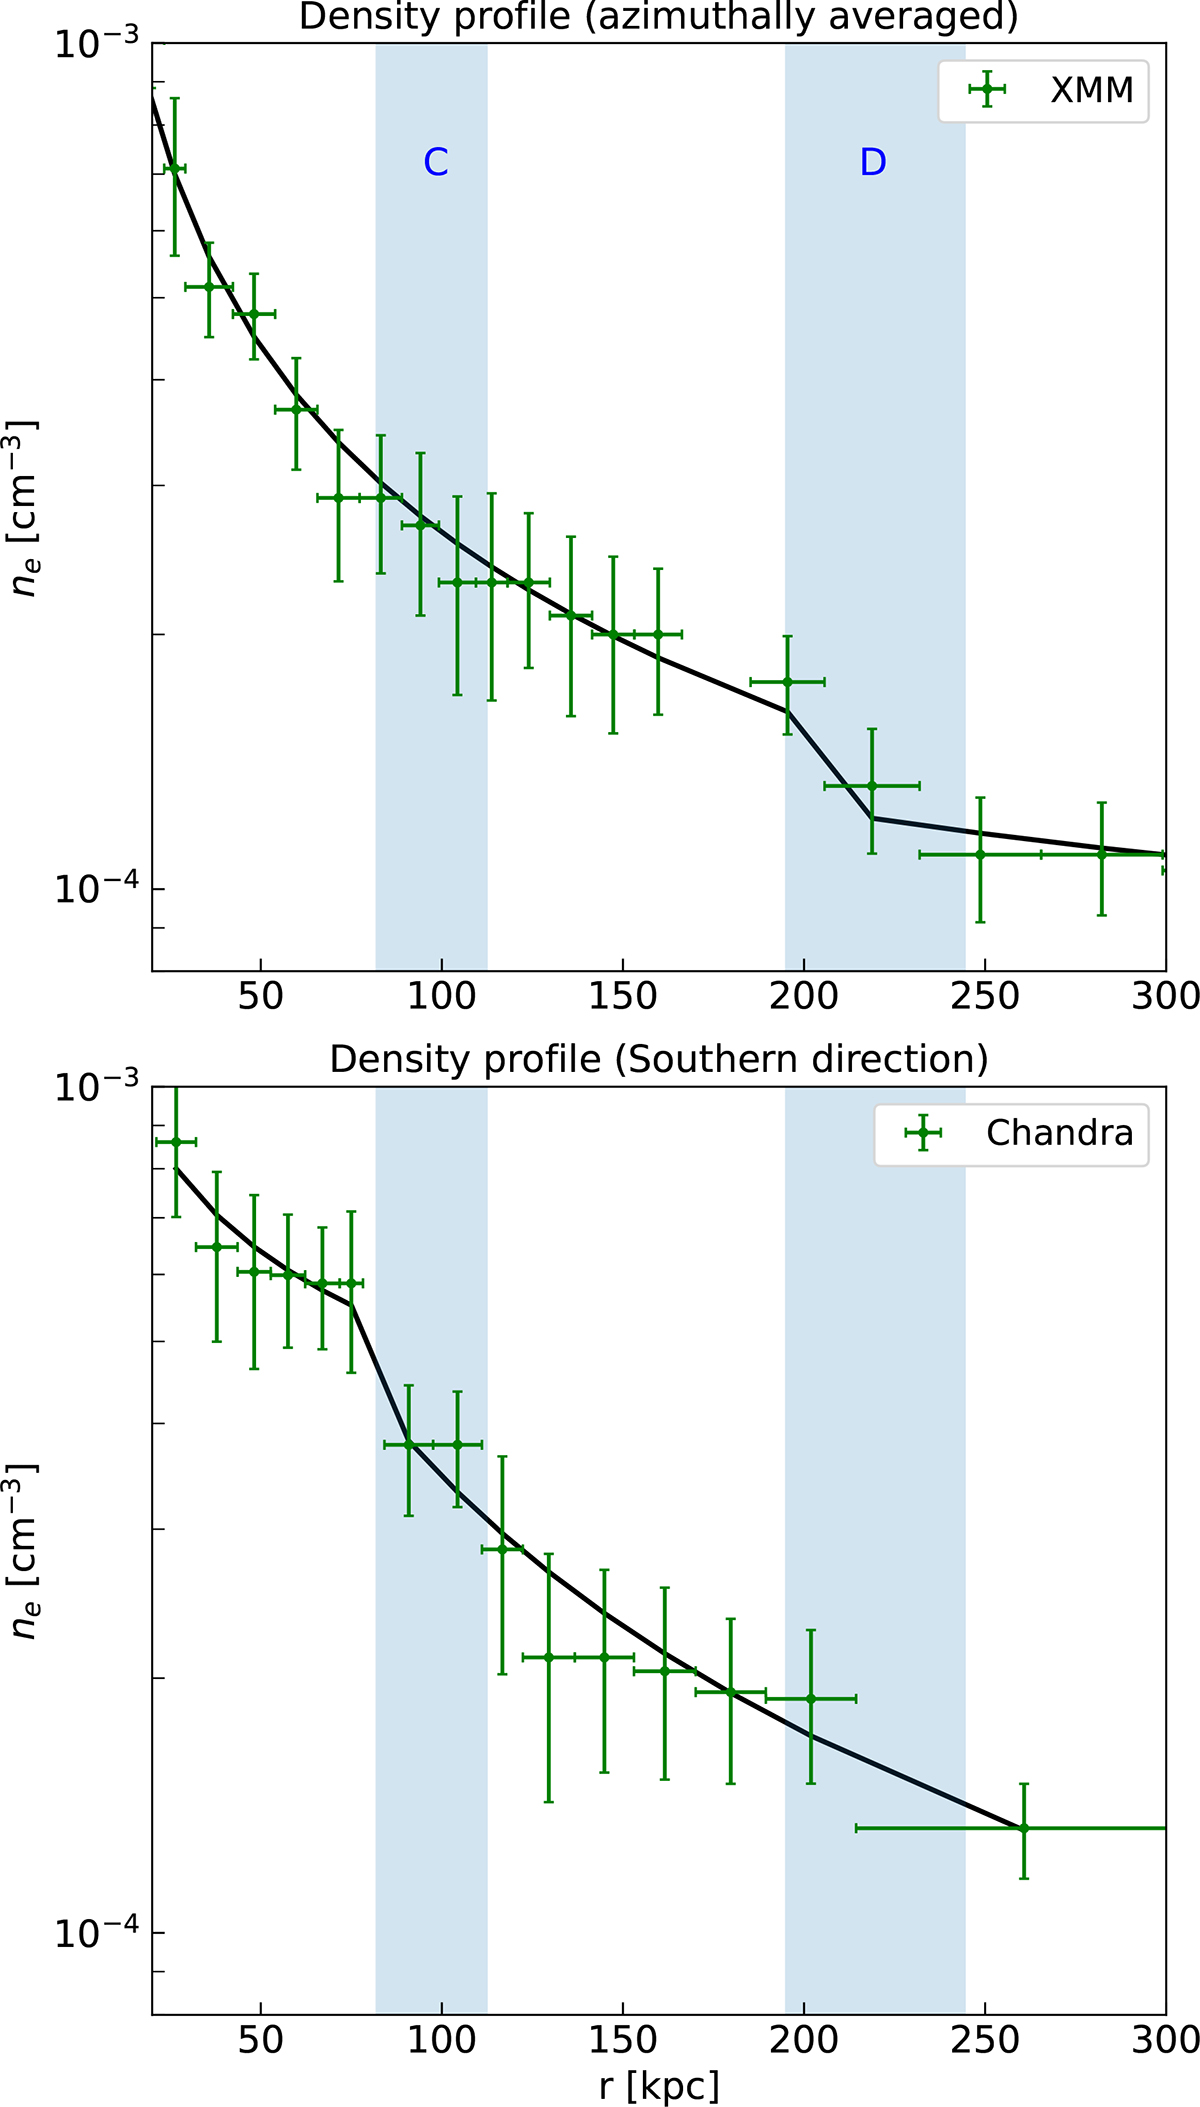
Top: Azimuthally averaged XMM-Newton density profile. Bottom: Chandra density profile along the southern lobes. The sector used to extract this profile is shown in Figure 6 inset. The black lines show the fitted broken powerlaw model. The shaded regions show the extent of the C and D lobes from the center of Nest.
Current usage metrics show cumulative count of Article Views (full-text article views including HTML views, PDF and ePub downloads, according to the available data) and Abstracts Views on Vision4Press platform.
Data correspond to usage on the plateform after 2015. The current usage metrics is available 48-96 hours after online publication and is updated daily on week days.
Initial download of the metrics may take a while.