Fig. 7.
Download original image
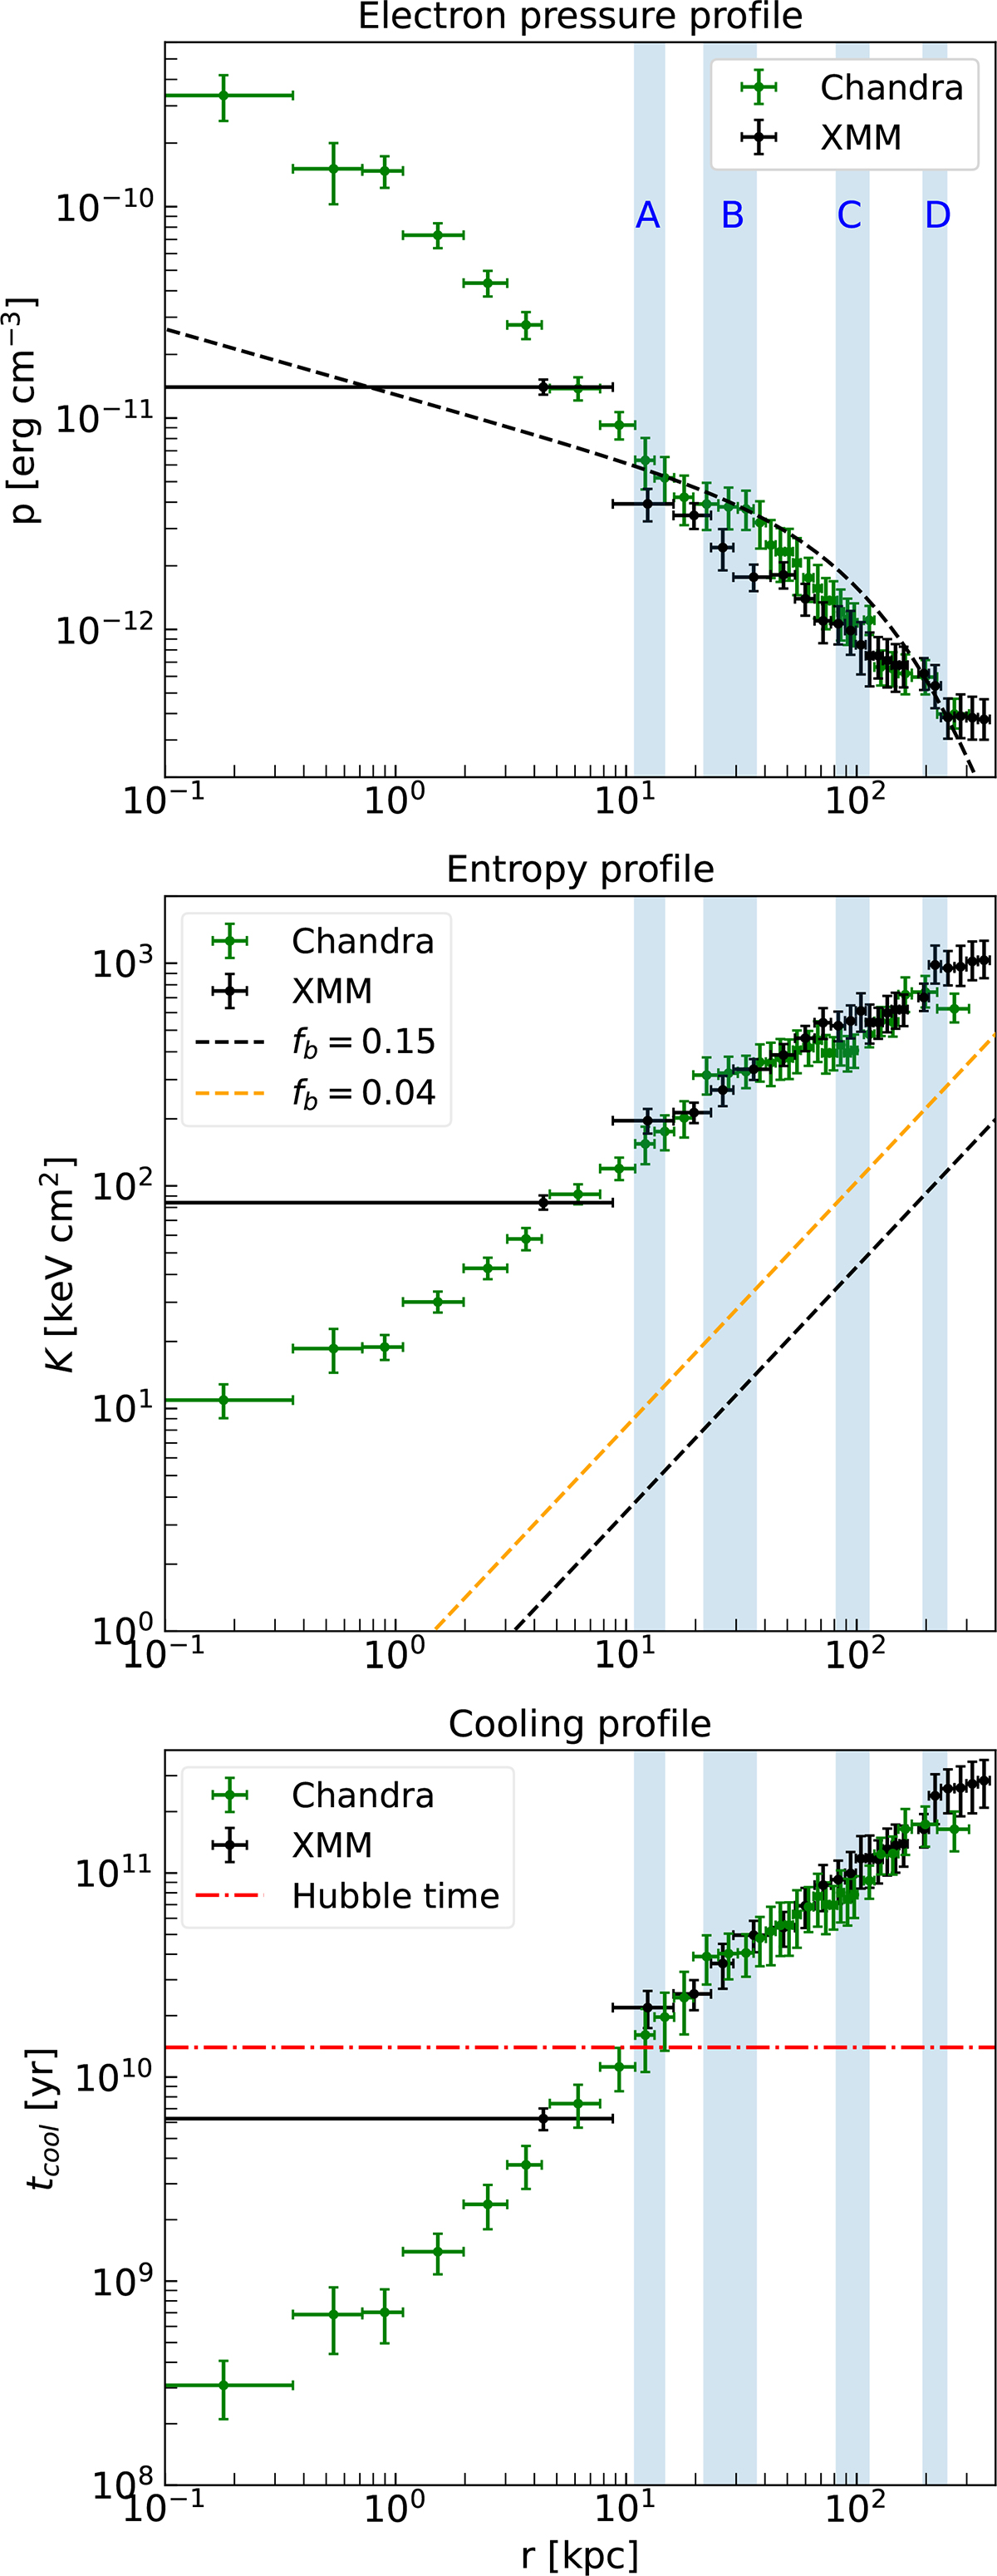
Top: Azimuthally averaged electron pressure profiles. The average expected profile from Planck clusters is shown with a black dashed line. Middle: Azimuthally averaged entropy profile. The self-similar r1.1 profile for fb = 0.15 is shown with a black dashed line, while the fb = 0.04 profile is shown with an orange dashed line. Bottom: Radial profile of the cooling time obtained from azimuthally averaged density, temperature, and metallicity profiles. The Hubble time 1/H0 is shown in red. The shaded regions show the extent of the four lobes shown in Figures 1 from the center of Nest.
Current usage metrics show cumulative count of Article Views (full-text article views including HTML views, PDF and ePub downloads, according to the available data) and Abstracts Views on Vision4Press platform.
Data correspond to usage on the plateform after 2015. The current usage metrics is available 48-96 hours after online publication and is updated daily on week days.
Initial download of the metrics may take a while.