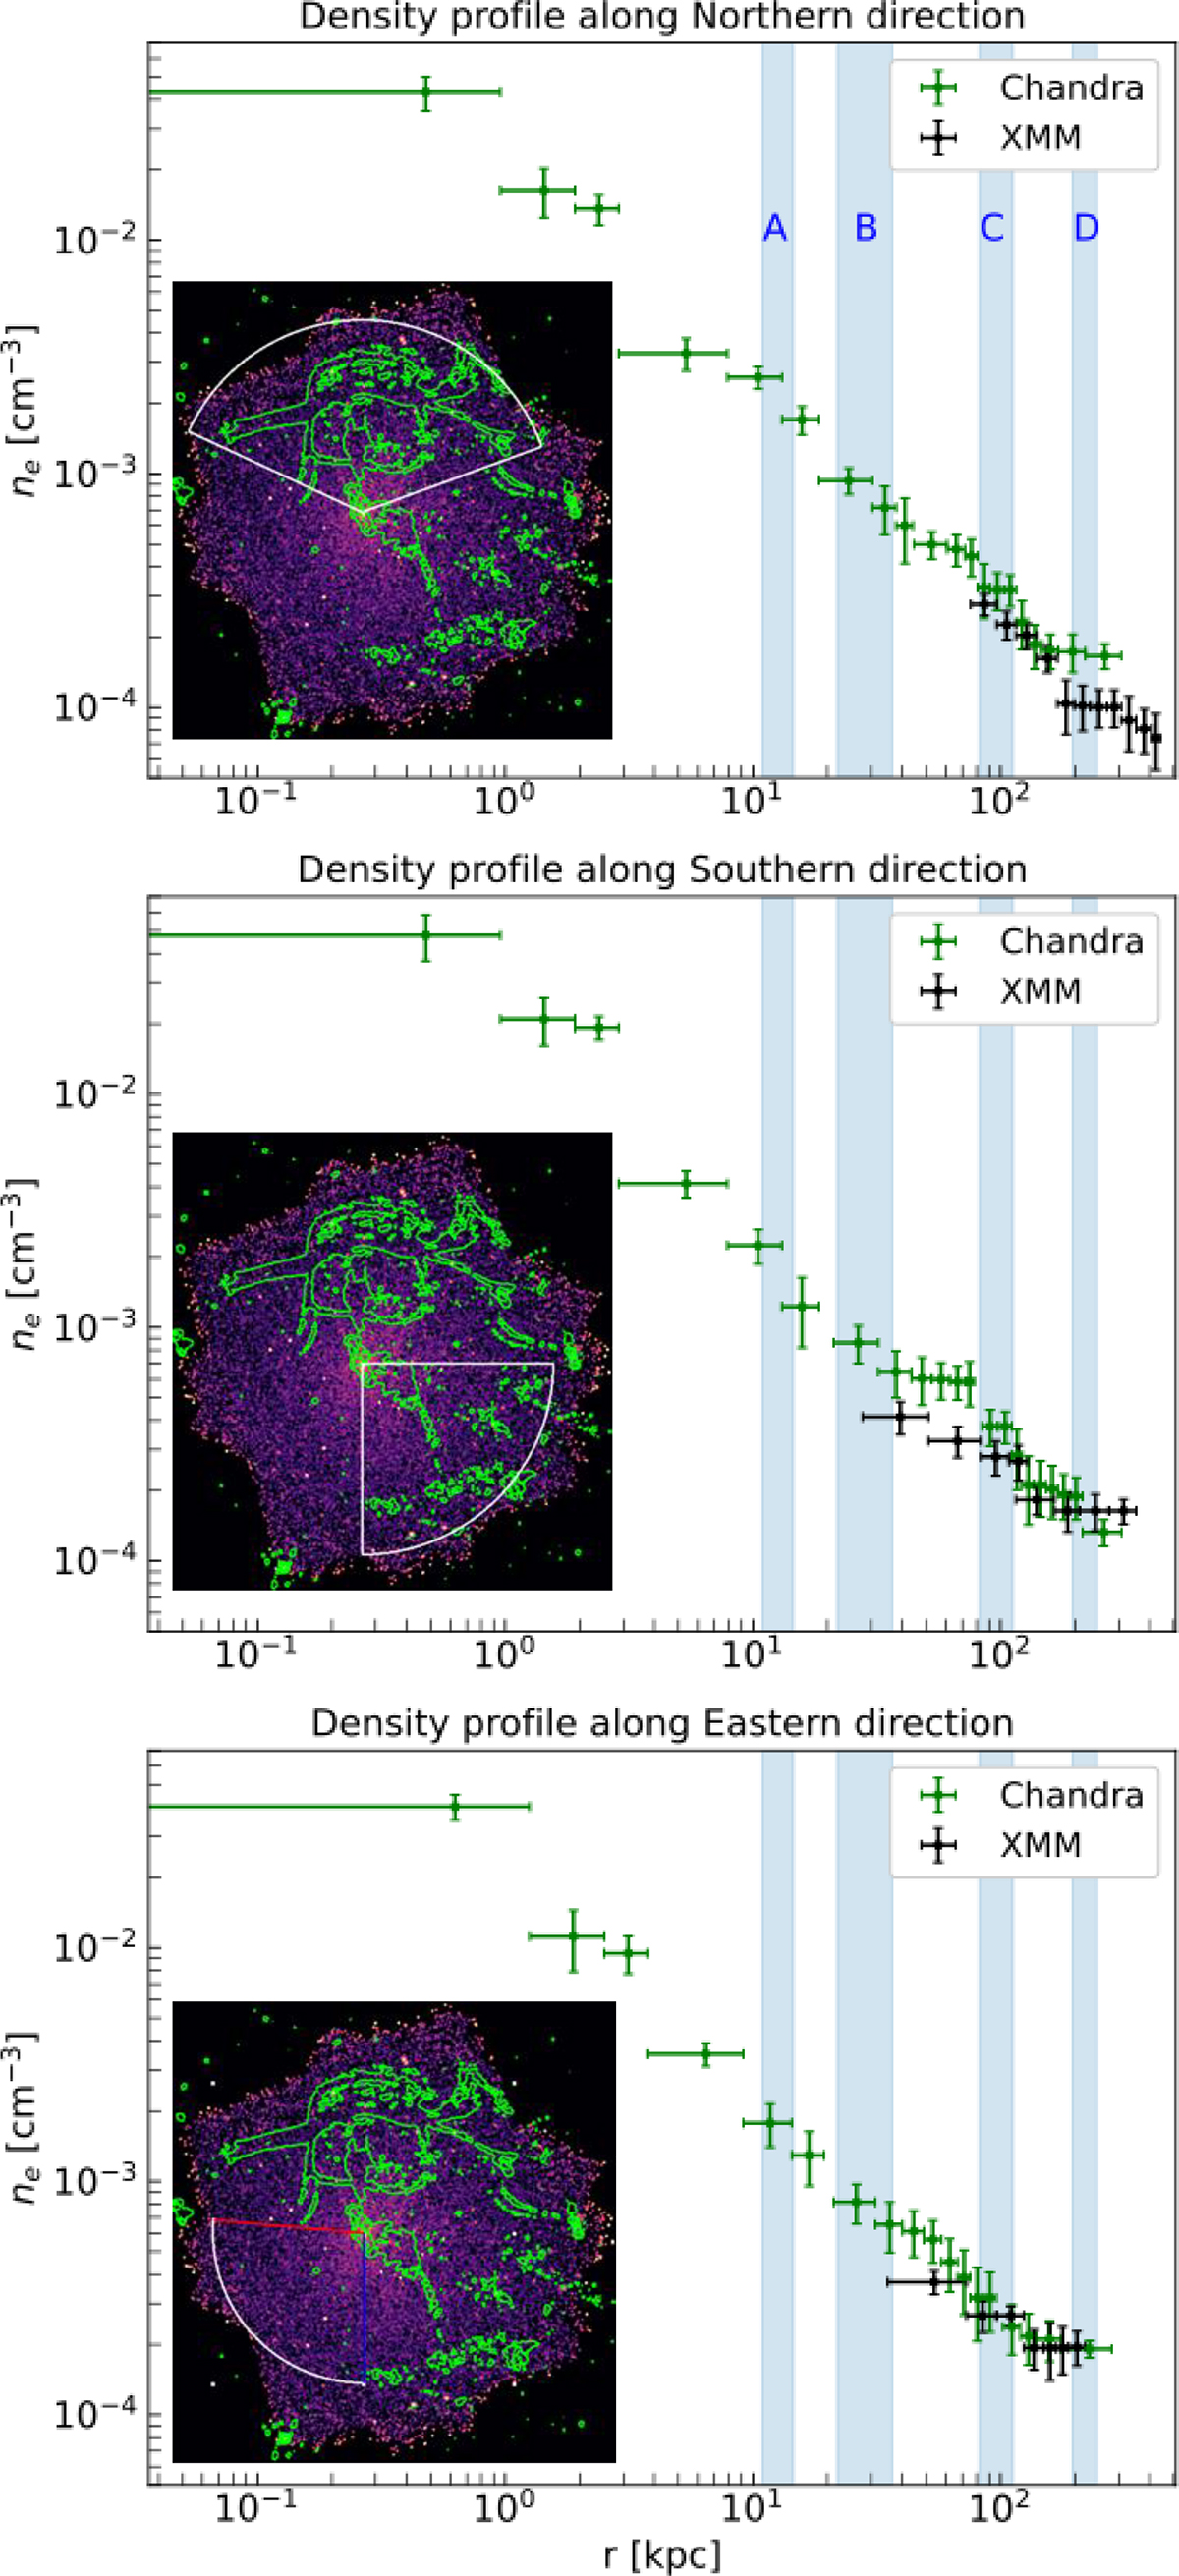
Fig. 6.
Download original image
Top: Density profile along the northern lobes. Middle: Density profile along the southern lobes. Bottom: Density profile along the eastern direction where there is no radio emission. The shaded regions show the extent of the four lobes shown in Figures 1 from the center of Nest. The inset figures show the extraction regions.
Current usage metrics show cumulative count of Article Views (full-text article views including HTML views, PDF and ePub downloads, according to the available data) and Abstracts Views on Vision4Press platform.
Data correspond to usage on the plateform after 2015. The current usage metrics is available 48-96 hours after online publication and is updated daily on week days.
Initial download of the metrics may take a while.