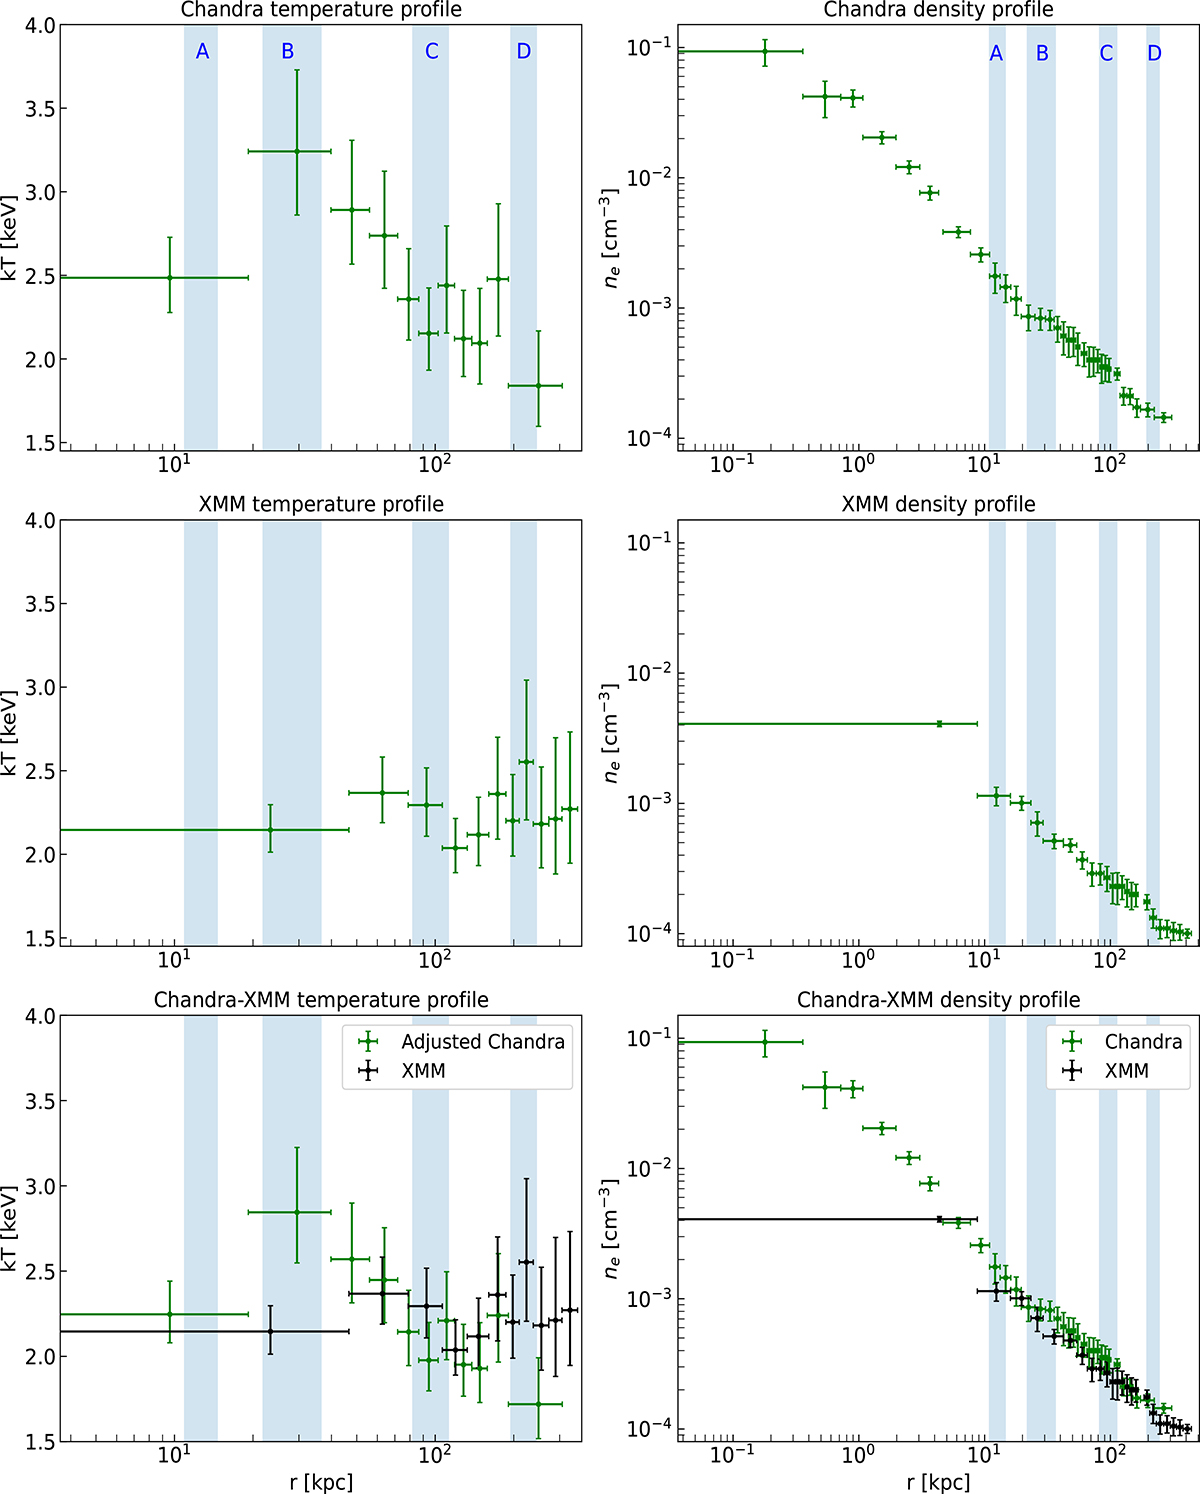
Fig. 4.
Download original image
Temperature profiles (left panel) and density profiles (right panel). First row: Chandra temperature and deprojected density profile as a function of projected radius. Second row: XMM-Newton temperature and deprojected density profile as a function of projected radius. Third row: Comparison between Chandra and XMM-Newton temperature and density profiles after taking into account systematics. The shaded regions show the extent of the four lobes shown in Figures 1 from the center of Nest.
Current usage metrics show cumulative count of Article Views (full-text article views including HTML views, PDF and ePub downloads, according to the available data) and Abstracts Views on Vision4Press platform.
Data correspond to usage on the plateform after 2015. The current usage metrics is available 48-96 hours after online publication and is updated daily on week days.
Initial download of the metrics may take a while.