Fig. 3.
Download original image
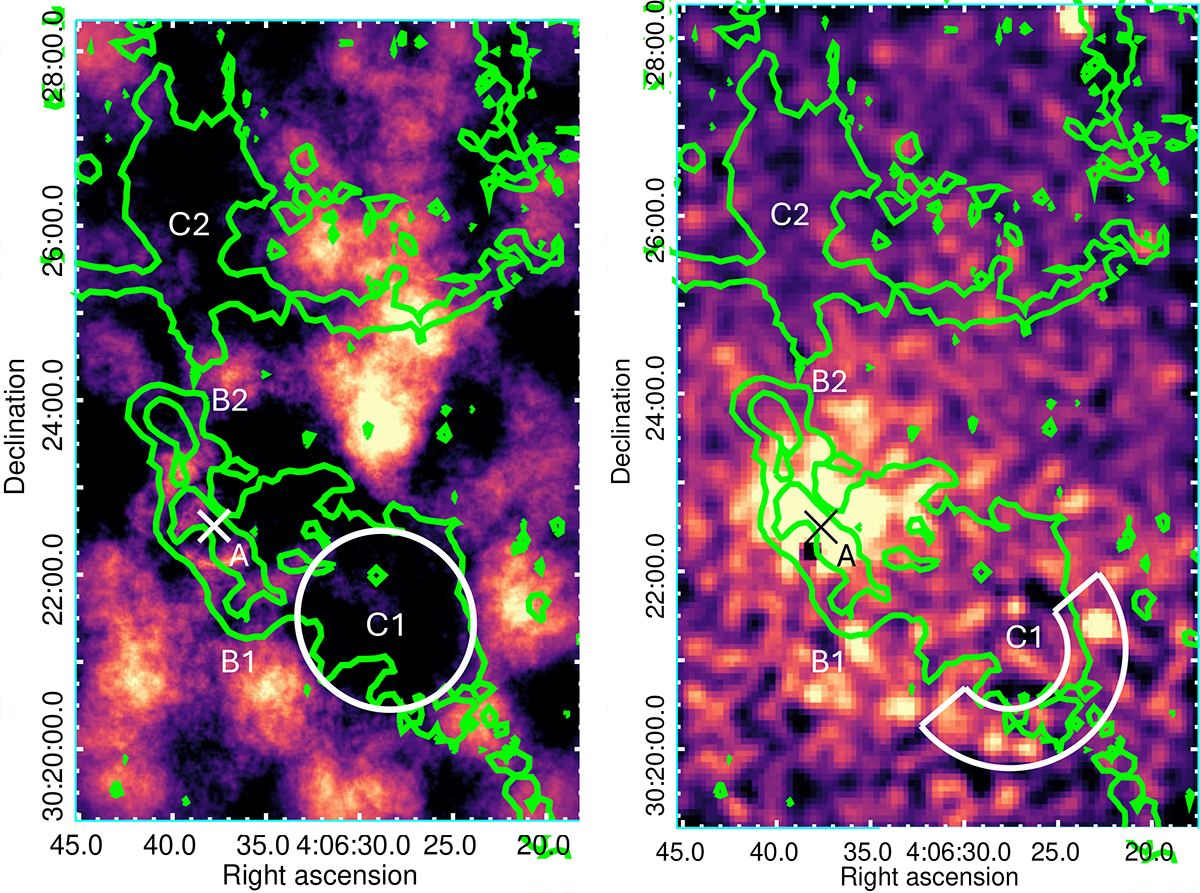
Left: Chandra residual map after subtracting a spherically symmetric double beta model fit to the surface brightness profile of Nest. A depression near the C1 lobe can be seen in the image and has been highlighted as a circular region. A further possible depression may be present near the C2 lobe. The image has been heavily Gaussian-smoothed with a σ = 30″ and r = 30″ for better visualization. Right: XMM-Newton exposure-corrected image showing the region around the C1 lobe. The image has been Gaussian-smoothed with a σ = 6″ and r = 12″ for better visualization. A possible limb-brightened feature around the C1 lobe is shown in the figure as a wedge. The LOFAR radio contours from Figure 2 are shown in green. The X-ray center of the group has been marked with a cross in each figure. The different lobes have also been marked on each figure.
Current usage metrics show cumulative count of Article Views (full-text article views including HTML views, PDF and ePub downloads, according to the available data) and Abstracts Views on Vision4Press platform.
Data correspond to usage on the plateform after 2015. The current usage metrics is available 48-96 hours after online publication and is updated daily on week days.
Initial download of the metrics may take a while.