Open Access
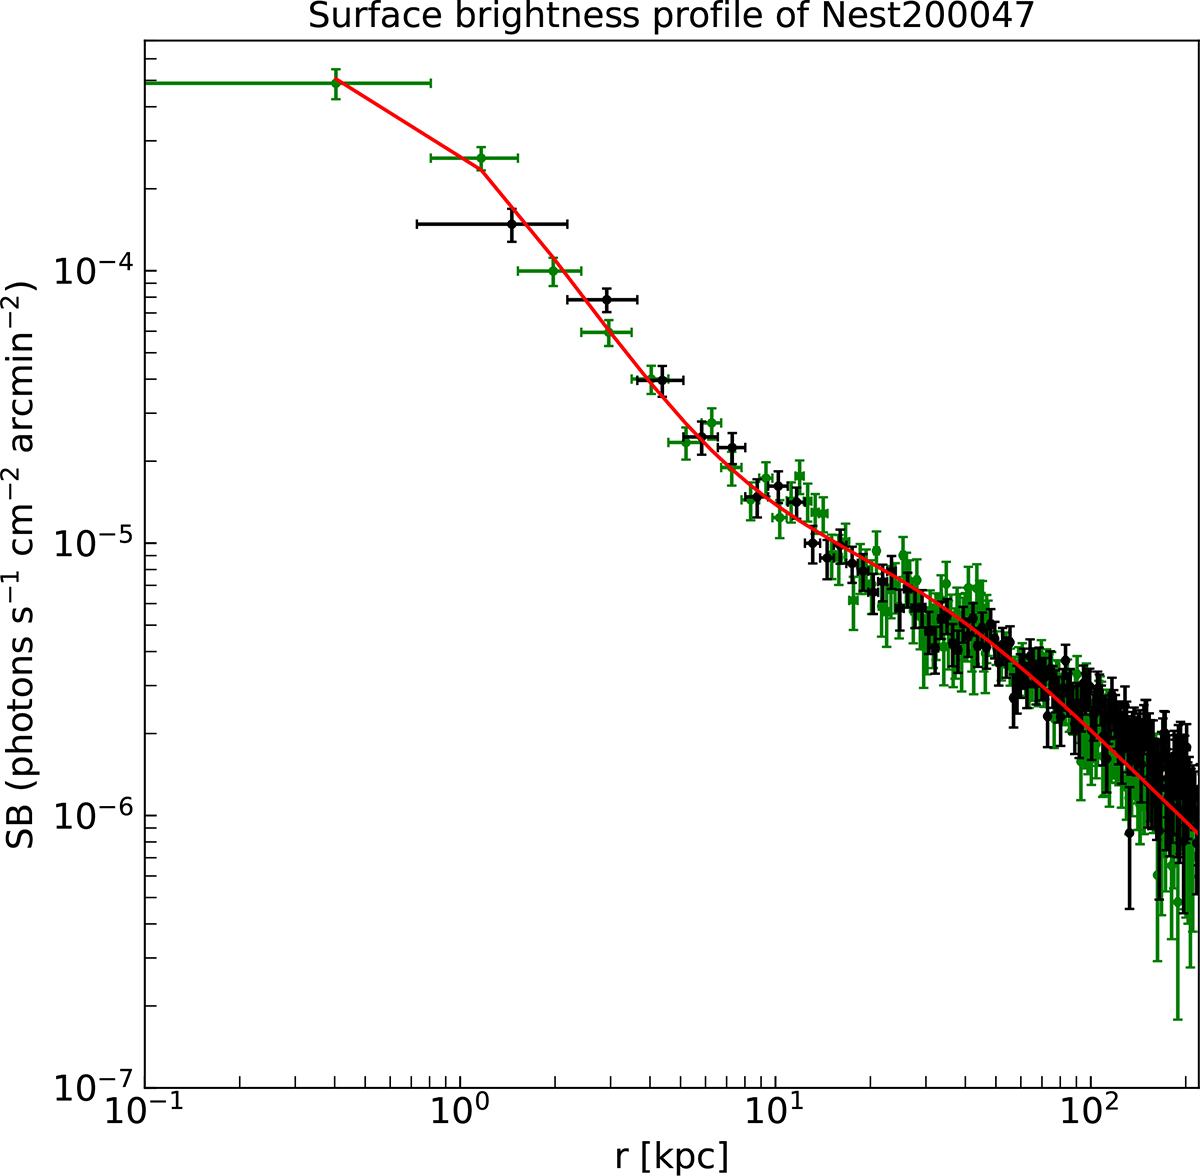
Fig. B.1.
Download original image
Chandra surface brightness profile is shown in green, while the XMM-Newton profile is shown in black. The fit to the Chandra profile used to obtain the left panel of Figure 3 is shown in red.
Current usage metrics show cumulative count of Article Views (full-text article views including HTML views, PDF and ePub downloads, according to the available data) and Abstracts Views on Vision4Press platform.
Data correspond to usage on the plateform after 2015. The current usage metrics is available 48-96 hours after online publication and is updated daily on week days.
Initial download of the metrics may take a while.