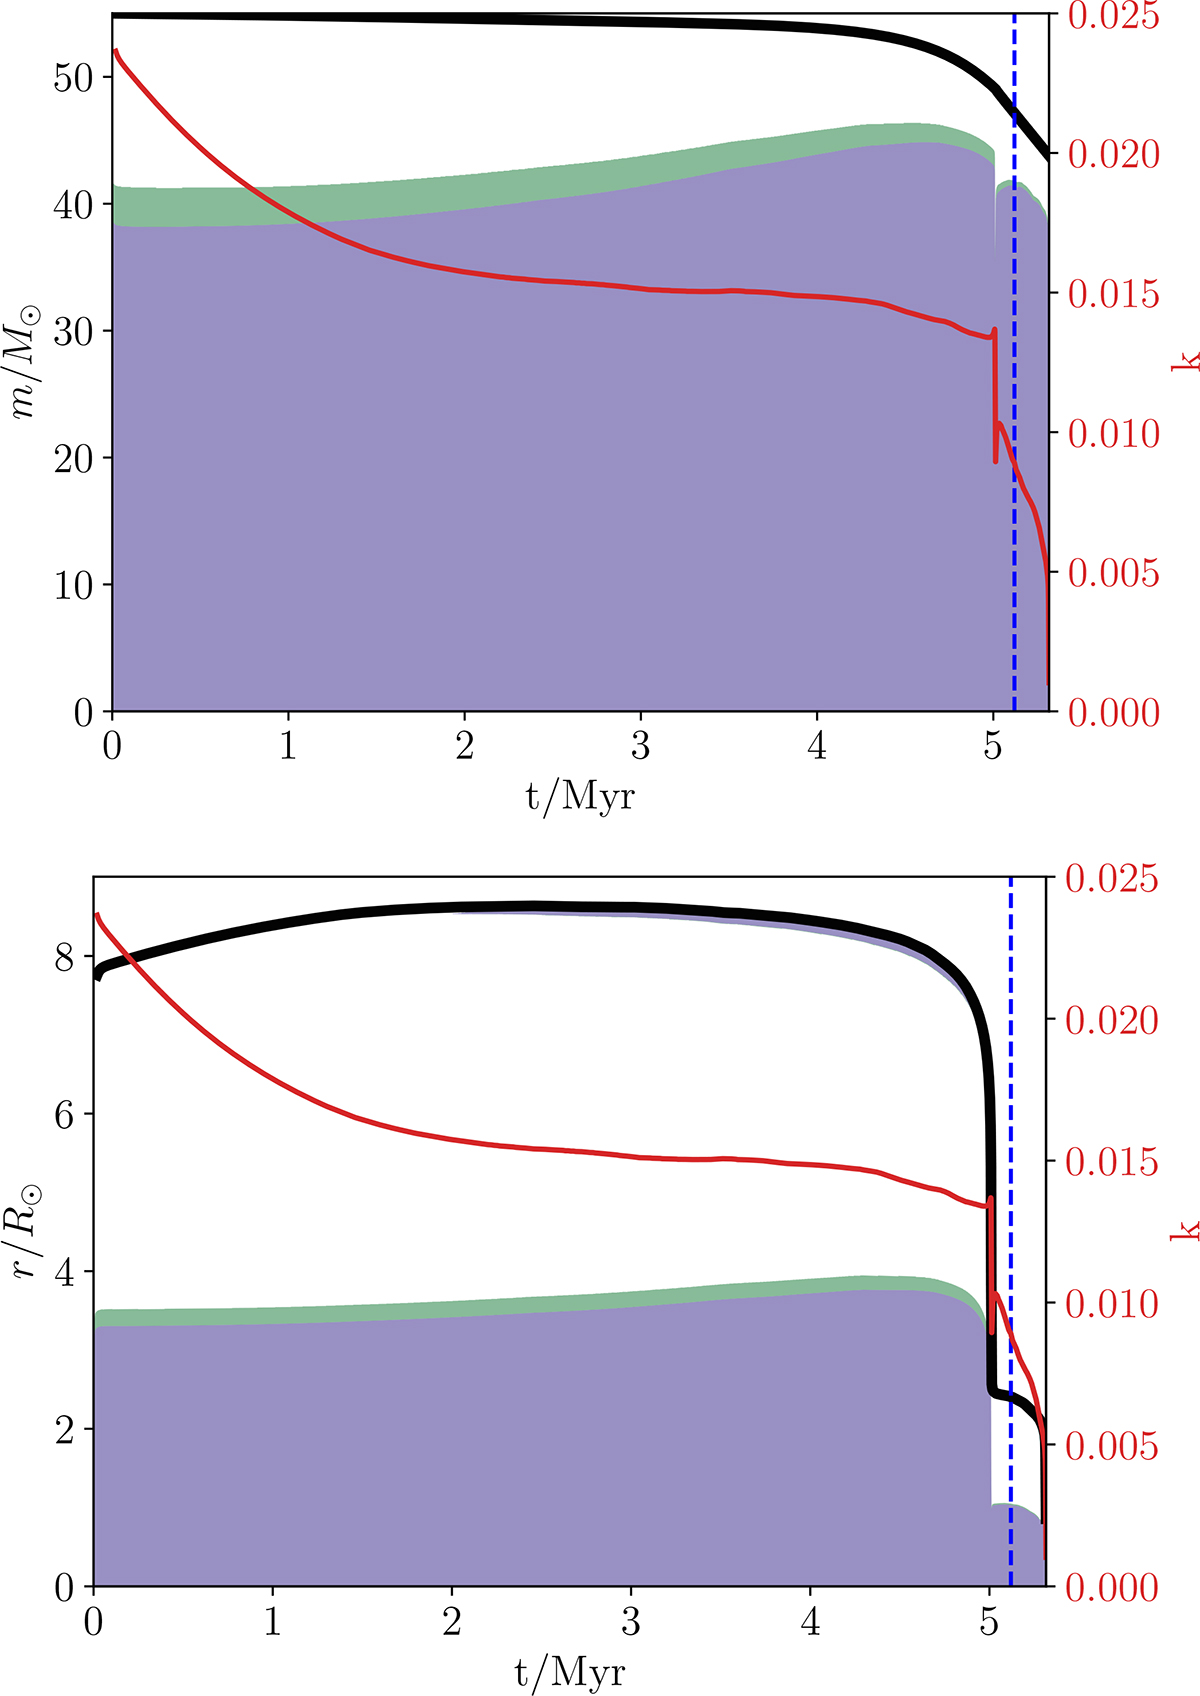
Fig. 1.
Download original image
Kippenhahn diagrams showing mass (m) and radial (r) coordinates as a function of time (t) for a 55 M⊙ star model with metallicity Z = 0.00042, undergoing chemically homogenous evolution. The total mass or radius is shown with a thick solid black curve. Convective regions are highlighted in purple, and regions with overshooting are marked in green. In addition, the apsidal motion constant (k) is shown as a solid red line, with its scale in the right side of the ordinate axis. Finally, we show a vertical dashed blue line at 5.12 Myr; we later use this model to assess stellar mergers shortly after the end of the main sequence.
Current usage metrics show cumulative count of Article Views (full-text article views including HTML views, PDF and ePub downloads, according to the available data) and Abstracts Views on Vision4Press platform.
Data correspond to usage on the plateform after 2015. The current usage metrics is available 48-96 hours after online publication and is updated daily on week days.
Initial download of the metrics may take a while.