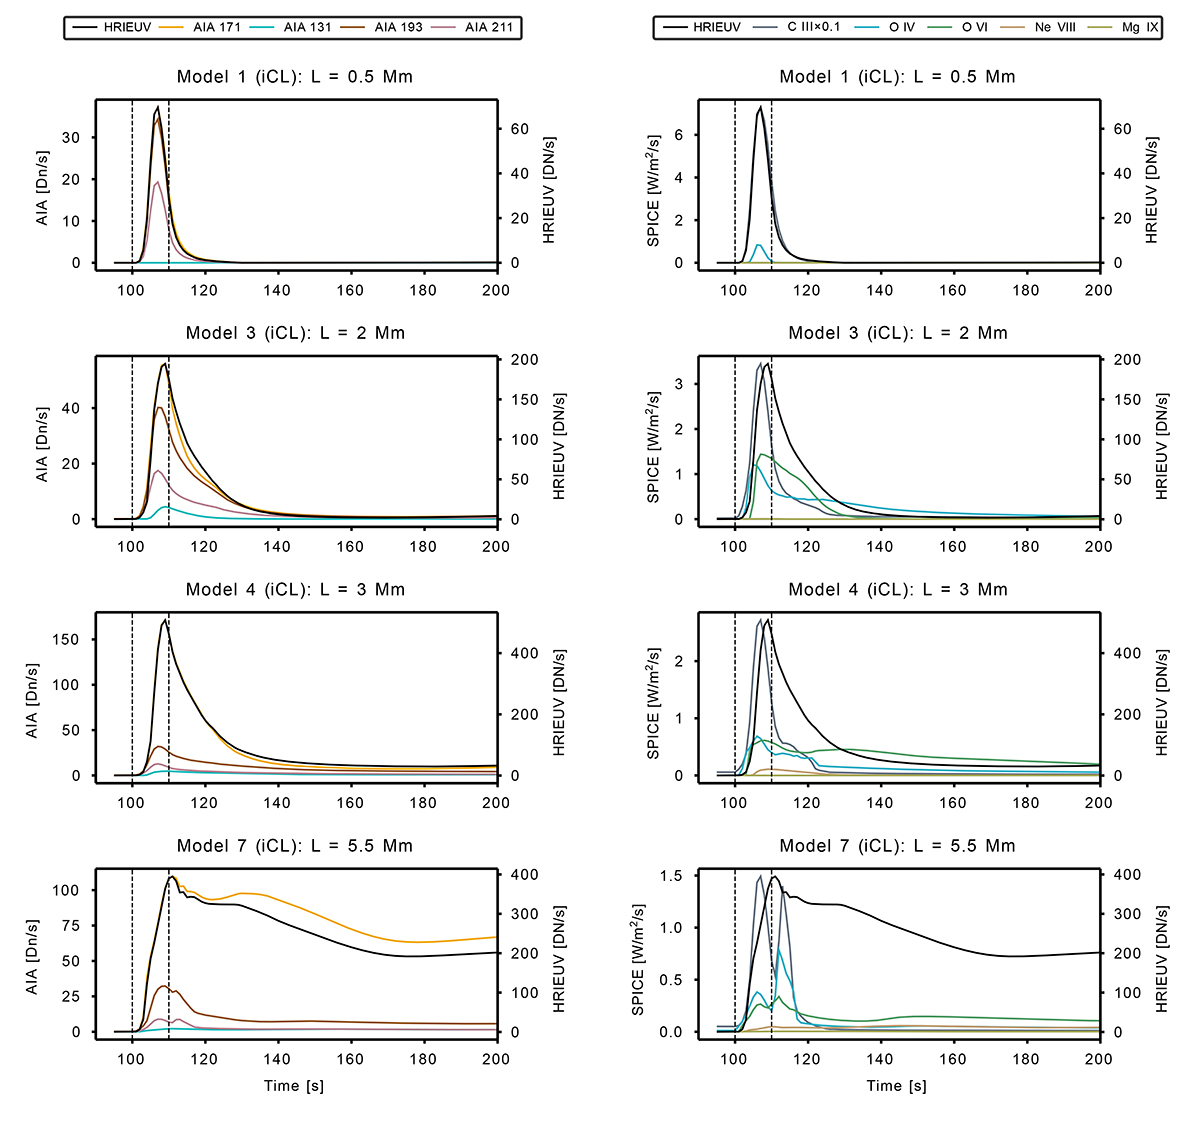
Fig. 6.

Download original image
Light curves for the simulations of four group I models, with loops in an initial cool state (Table 1). In this case, the length L of the loop’s central part increases from 0.5 Mm to 5.5 Mm. The intensities correspond to four AIA channels (left column), five SPICE lines (right column), and HRIEUV (on the right axis of all subfigures). For better visibility, the intensity of the C III line is divided by 10. Results are presented between t = 90 and 200 s, with the start (t = 100 s) and the end times (t = 110 s) of the impulsive heating indicated by two vertical dotted lines.
Current usage metrics show cumulative count of Article Views (full-text article views including HTML views, PDF and ePub downloads, according to the available data) and Abstracts Views on Vision4Press platform.
Data correspond to usage on the plateform after 2015. The current usage metrics is available 48-96 hours after online publication and is updated daily on week days.
Initial download of the metrics may take a while.


