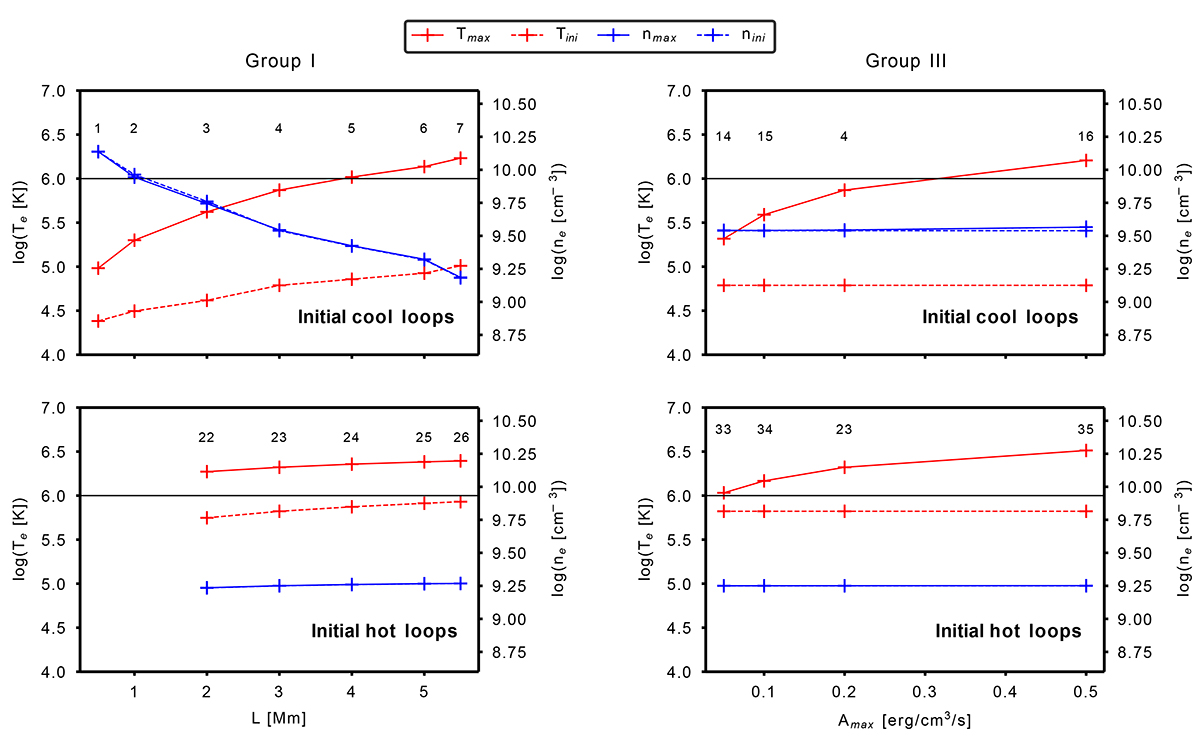
Fig. 4.
Download original image
Electron temperature Tmax and density nmax at the loop center (s = Lc + L/2) at the time of the temperature peak after the impulsive heating. Prior to the impulsive heating, the initial values Tini and nini at the loop center are provided for the loops in equilibrium. Results for groups I (left column) and III (right column) are shown for initial cool (upper row) and hot loops (lower row). The X-axis is the changing parameter associated with each group (L or Amax). Model numbers given in Tables 1 and 2 (i.e., m1 to m35) are displayed on top of their respective data points (crosses). The horizontal black line delimits the 1 MK temperature, above which the heating is likely to contribute to coronal heating.
Current usage metrics show cumulative count of Article Views (full-text article views including HTML views, PDF and ePub downloads, according to the available data) and Abstracts Views on Vision4Press platform.
Data correspond to usage on the plateform after 2015. The current usage metrics is available 48-96 hours after online publication and is updated daily on week days.
Initial download of the metrics may take a while.