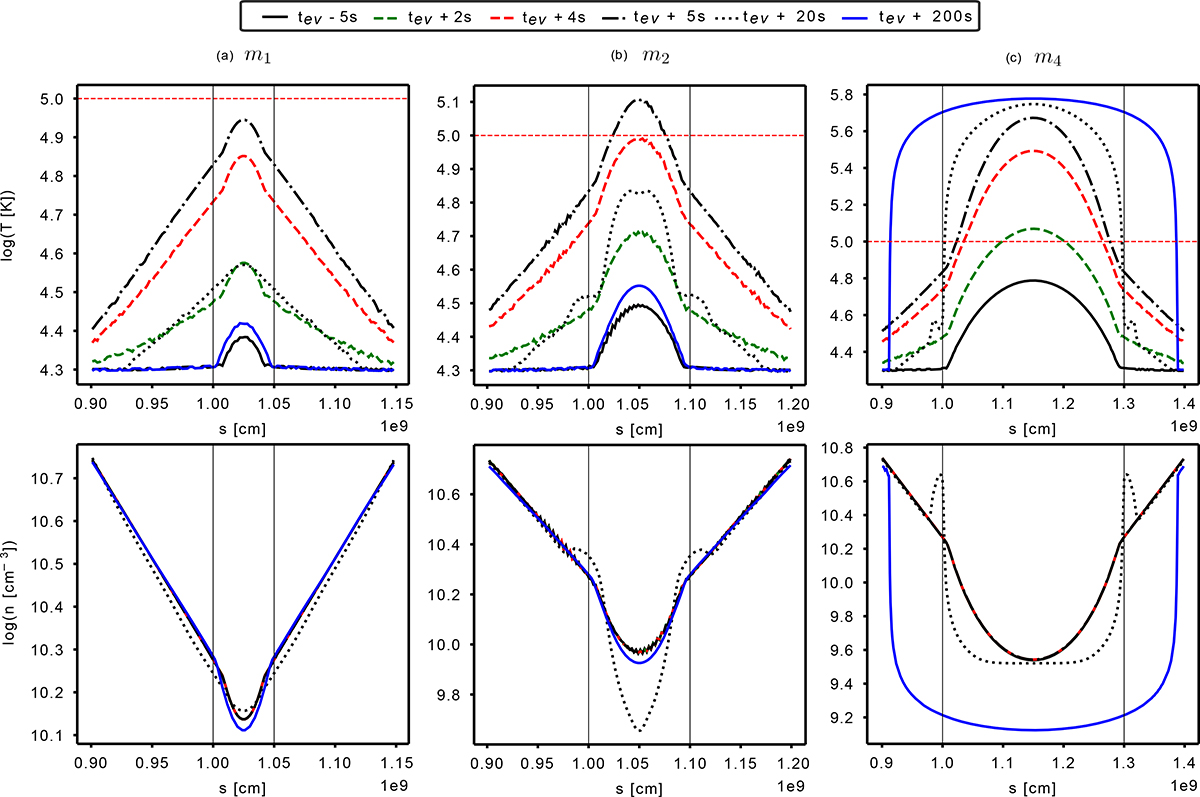
Fig. 3.
Download original image
Evolution of the electron temperature (top row) and density (bottom row) profiles with time for the simulations with the models (a) m1, (b) m2, and (c) m3 (L= 0.5, 1 and 3 Mm). The starting time of the impulsive heating is set at tev = 100 s. The vertical black lines indicate the basis of the loop’s central part and the horizontal dotted red line shows the values log T = 5.0. tev + 2 s (green) and tev + 4 s (red), which are the closest recorded times when m4 and m2 reach apex temperatures above log T = 5.0.
Current usage metrics show cumulative count of Article Views (full-text article views including HTML views, PDF and ePub downloads, according to the available data) and Abstracts Views on Vision4Press platform.
Data correspond to usage on the plateform after 2015. The current usage metrics is available 48-96 hours after online publication and is updated daily on week days.
Initial download of the metrics may take a while.