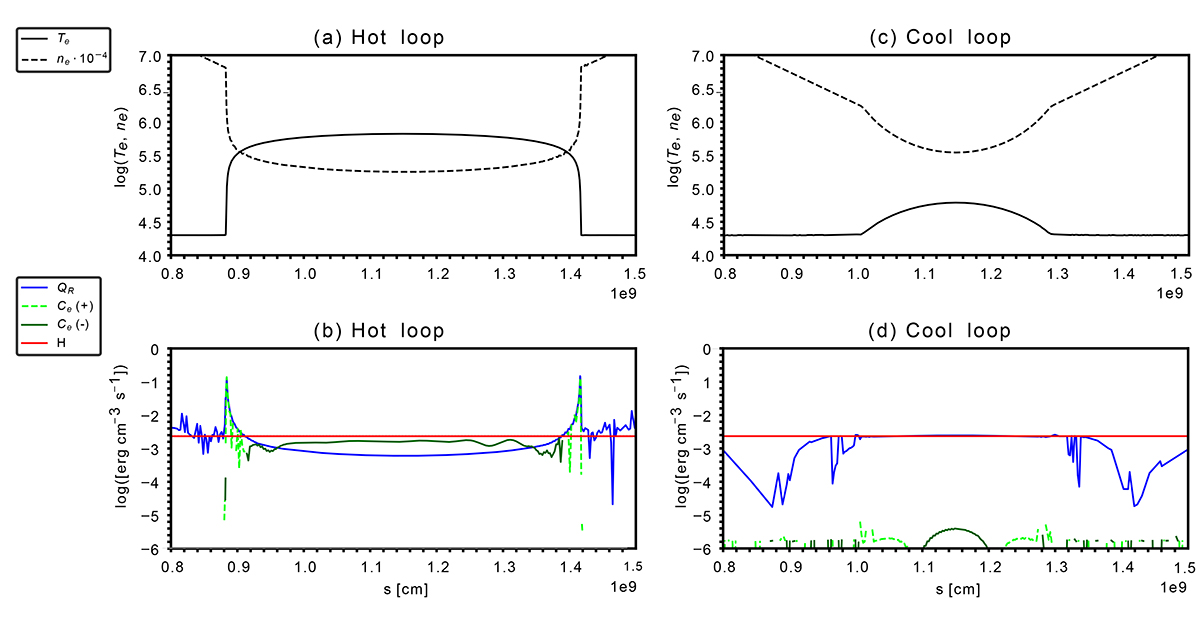
Fig. 2.
Download original image
Examples of a cool (left column) and a hot (right column) loop in equilibrium. Top row: Electron temperature (K) and density (10−4 cm−3) profiles along the loop. Bottom row: Profiles of the electron energy conservation terms along the loop: H = 2.3 × 10⁻³ erg cm−3 s−1 (red lines) is the uniform and constant heating term; QR is the power loss due to radiations; and Ce(+) (dotted light green lines) and Ce(−) (dark green lines) are the electron conduction, respectively, when they are a heating or a cooling term.
Current usage metrics show cumulative count of Article Views (full-text article views including HTML views, PDF and ePub downloads, according to the available data) and Abstracts Views on Vision4Press platform.
Data correspond to usage on the plateform after 2015. The current usage metrics is available 48-96 hours after online publication and is updated daily on week days.
Initial download of the metrics may take a while.