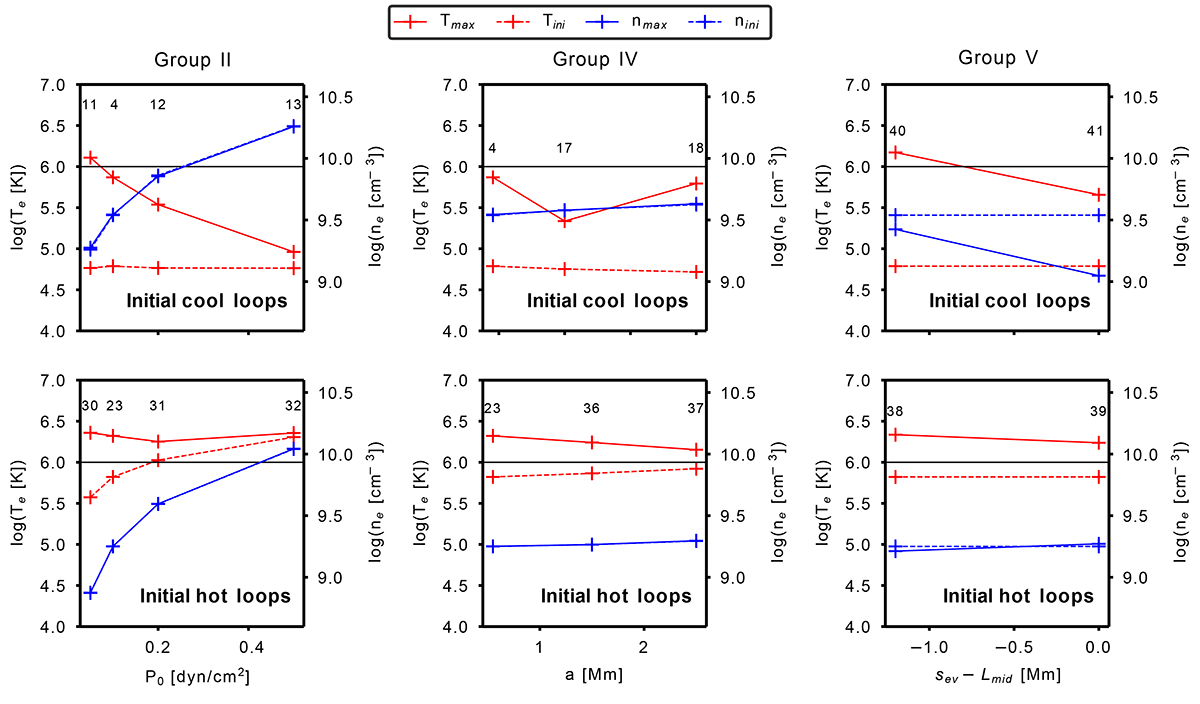
Fig. A.1.
Download original image
Maximal electron temperature Tmax and minimal electron density nmin reached during the simulation over the entire loop profile. Prior to the impulsive heating, the initial values Tini and nini are also given when the loops were in equilibrium. Results for models from the groups II, IV and V are separated by columns from left to right, with the X-axis being the changing parameter associated with each group. Every models number given in Tables 1–2 (i.e., m1 to m35) are displayed on top of their respective data points (crosses), either for an initial cool (top row) or hot loop (bottom row). The horizontal black line delimits the 1 MK temperature.
Current usage metrics show cumulative count of Article Views (full-text article views including HTML views, PDF and ePub downloads, according to the available data) and Abstracts Views on Vision4Press platform.
Data correspond to usage on the plateform after 2015. The current usage metrics is available 48-96 hours after online publication and is updated daily on week days.
Initial download of the metrics may take a while.