Fig. 11.
Download original image
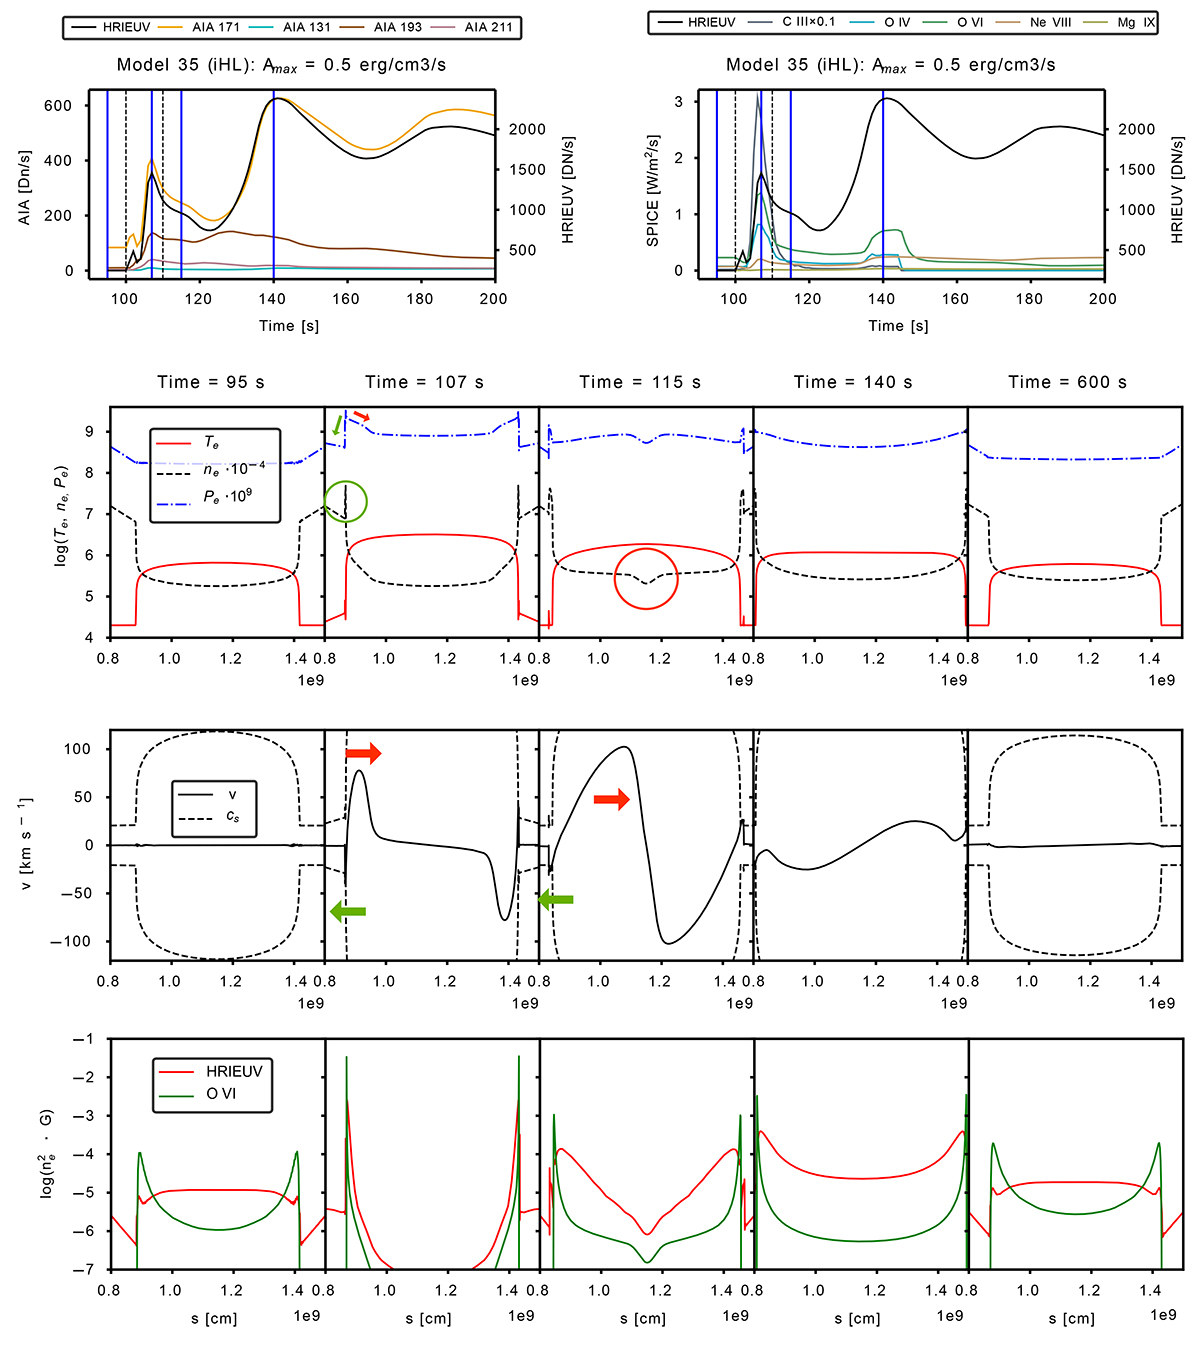
Same as for Fig. 10, but for the model m35, which consists of an initial hot loop submitted to an impulsive heating with a large maximal amplitude of ![]() . Green and red arrows highlight the flows responsible for the density fluctuations indicated by the respective green and red circles. These flows are discussed in detail in Section 3.4.2.
. Green and red arrows highlight the flows responsible for the density fluctuations indicated by the respective green and red circles. These flows are discussed in detail in Section 3.4.2.
Current usage metrics show cumulative count of Article Views (full-text article views including HTML views, PDF and ePub downloads, according to the available data) and Abstracts Views on Vision4Press platform.
Data correspond to usage on the plateform after 2015. The current usage metrics is available 48-96 hours after online publication and is updated daily on week days.
Initial download of the metrics may take a while.