Fig. 10.
Download original image
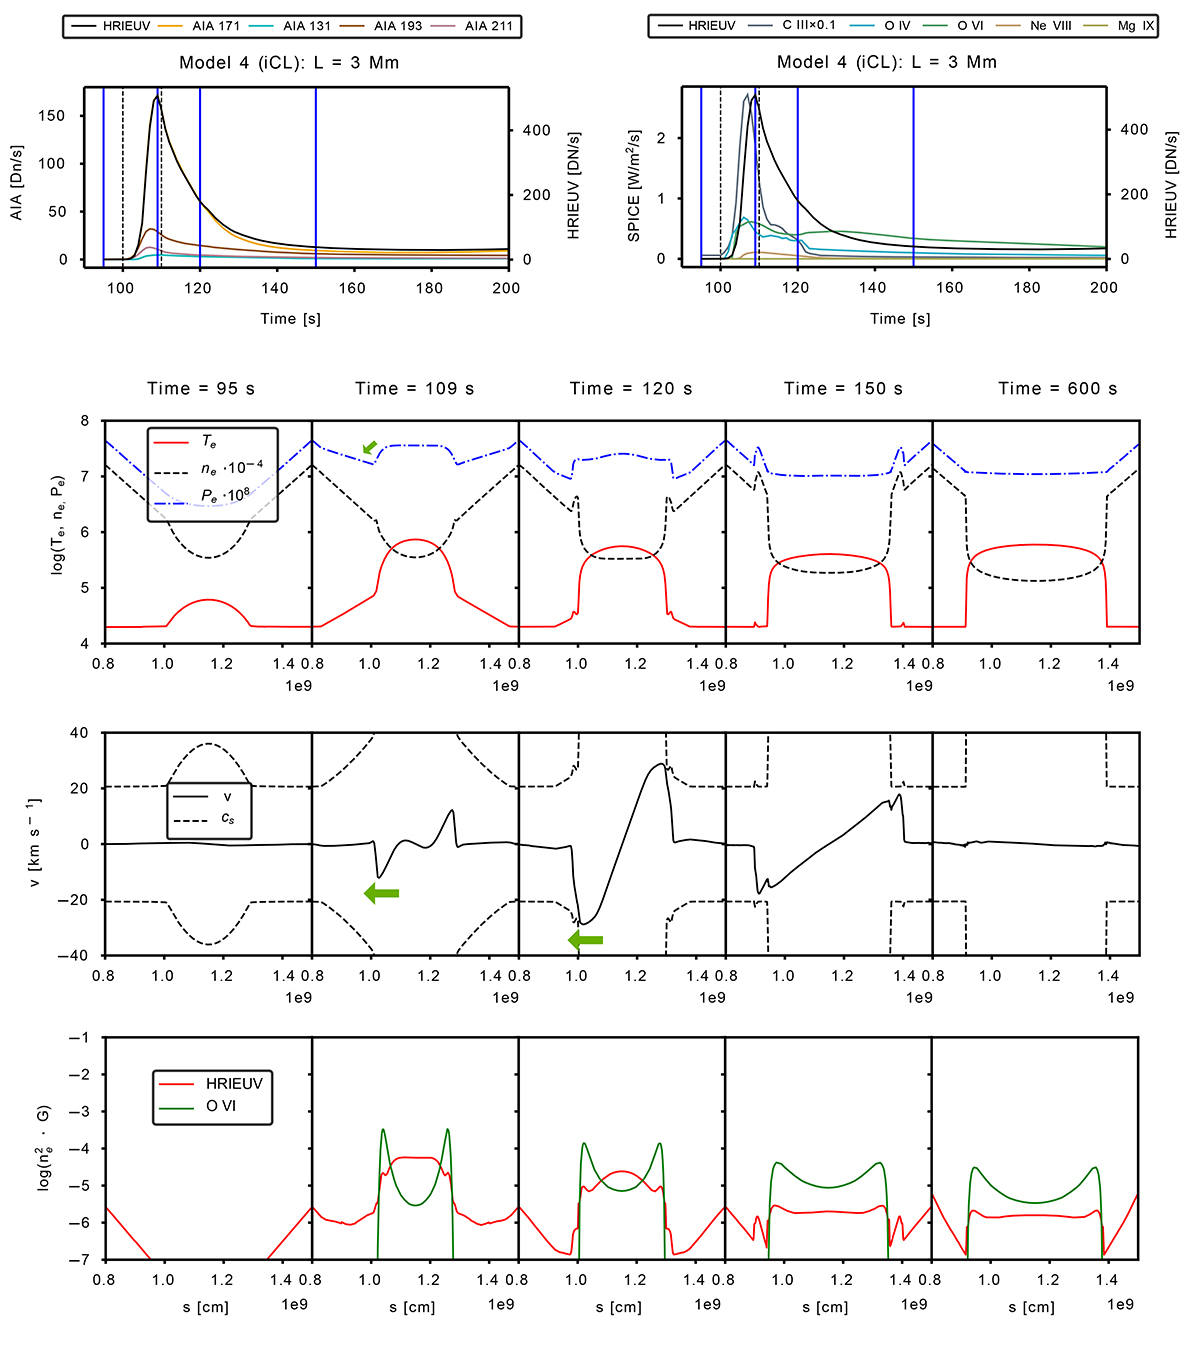
Results for model m4, with an initial cool loop. First row from the top: Light curves of HRIEUV, the AIA channels (left), and the SPICE lines (right) between t = 95 s and 200 s. The vertical dotted black lines show the beginning and end of the impulsive heating at 100 s and 110 s. The vertical blue lines indicate the times studied in the panels below. These panels are the same as in Fig. 7. Second row: Electron temperature, density, and pressure profiles around the loop’s central part. Green arrows show the pressure gradients that are responsible for the plasma flows. Third row: Velocity v and sound speed cs profiles. Green arrows indicate the direction of the flows. Fourth row: HRIEUV (in DN cm−1 s−1) and O VI (in mW m−3 s−1) emissivity profiles along the loop. The flows are discussed in detail in Section 3.4.1.
Current usage metrics show cumulative count of Article Views (full-text article views including HTML views, PDF and ePub downloads, according to the available data) and Abstracts Views on Vision4Press platform.
Data correspond to usage on the plateform after 2015. The current usage metrics is available 48-96 hours after online publication and is updated daily on week days.
Initial download of the metrics may take a while.