Fig. 8.
Download original image
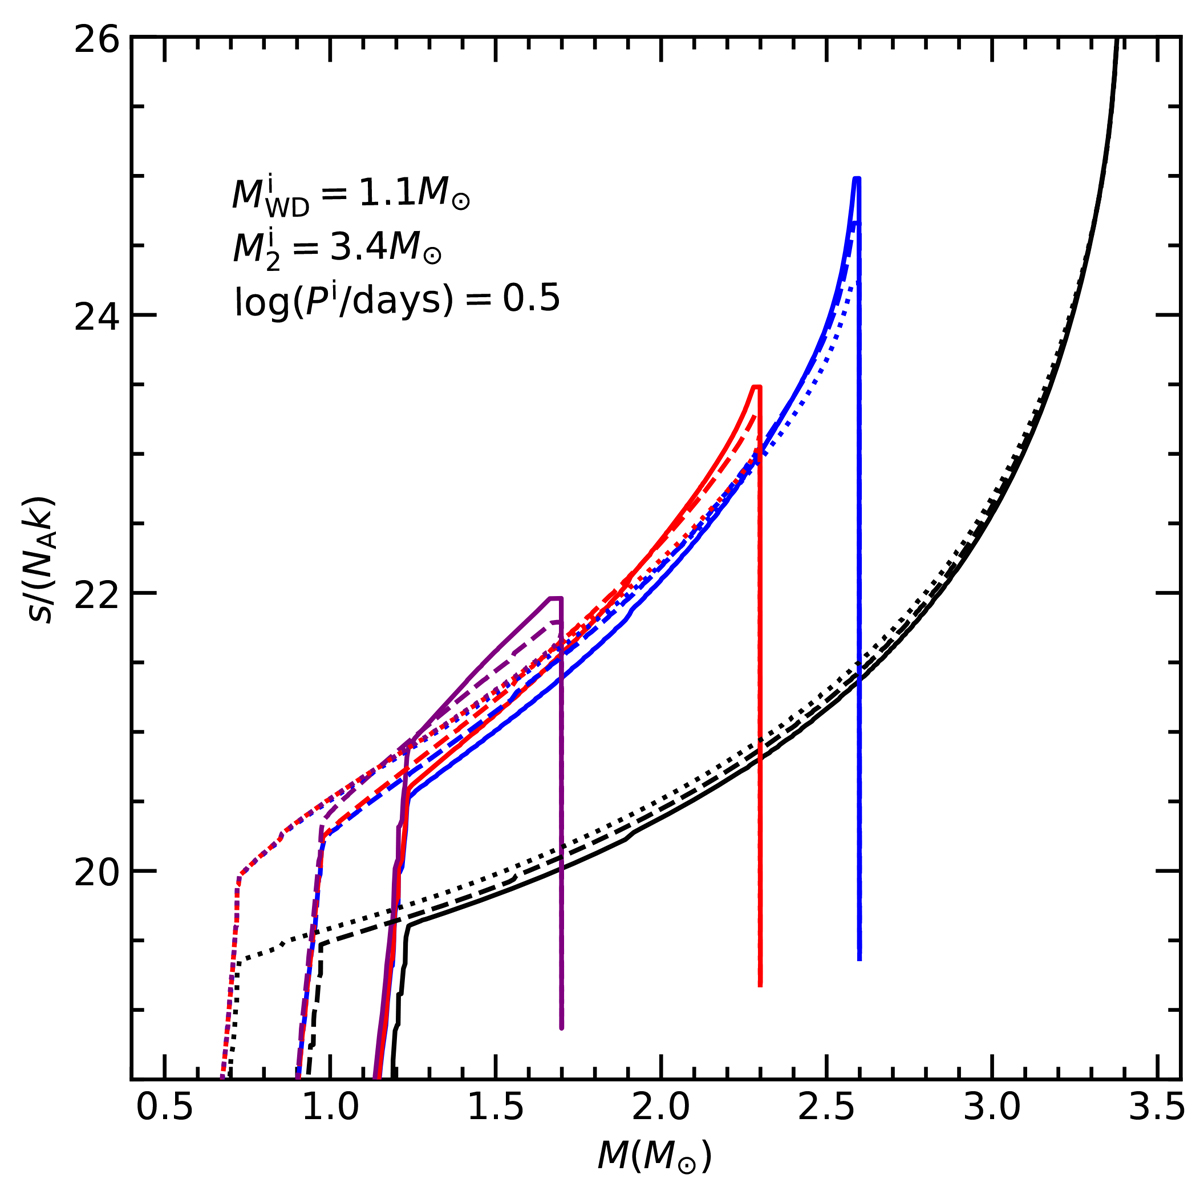
Entropy profiles of the donor star after it loses different amounts of mass for varying δov. The solid line represents δov = 0.50, the dashed line δov = 0.25, and the dotted line δov = 0.00. Black, blue, red, and purple represent the donor losing masses △M = 0.0 M⊙, △M = 0.8 M⊙, △M = 1.1 M⊙, and △M = 1.7 M⊙, respectively. The initial parameters are MWDi = 1.1 M⊙, M2i = 3.4 M⊙, and log Pi(days) = 0.5.
Current usage metrics show cumulative count of Article Views (full-text article views including HTML views, PDF and ePub downloads, according to the available data) and Abstracts Views on Vision4Press platform.
Data correspond to usage on the plateform after 2015. The current usage metrics is available 48-96 hours after online publication and is updated daily on week days.
Initial download of the metrics may take a while.