Fig. 4.
Download original image
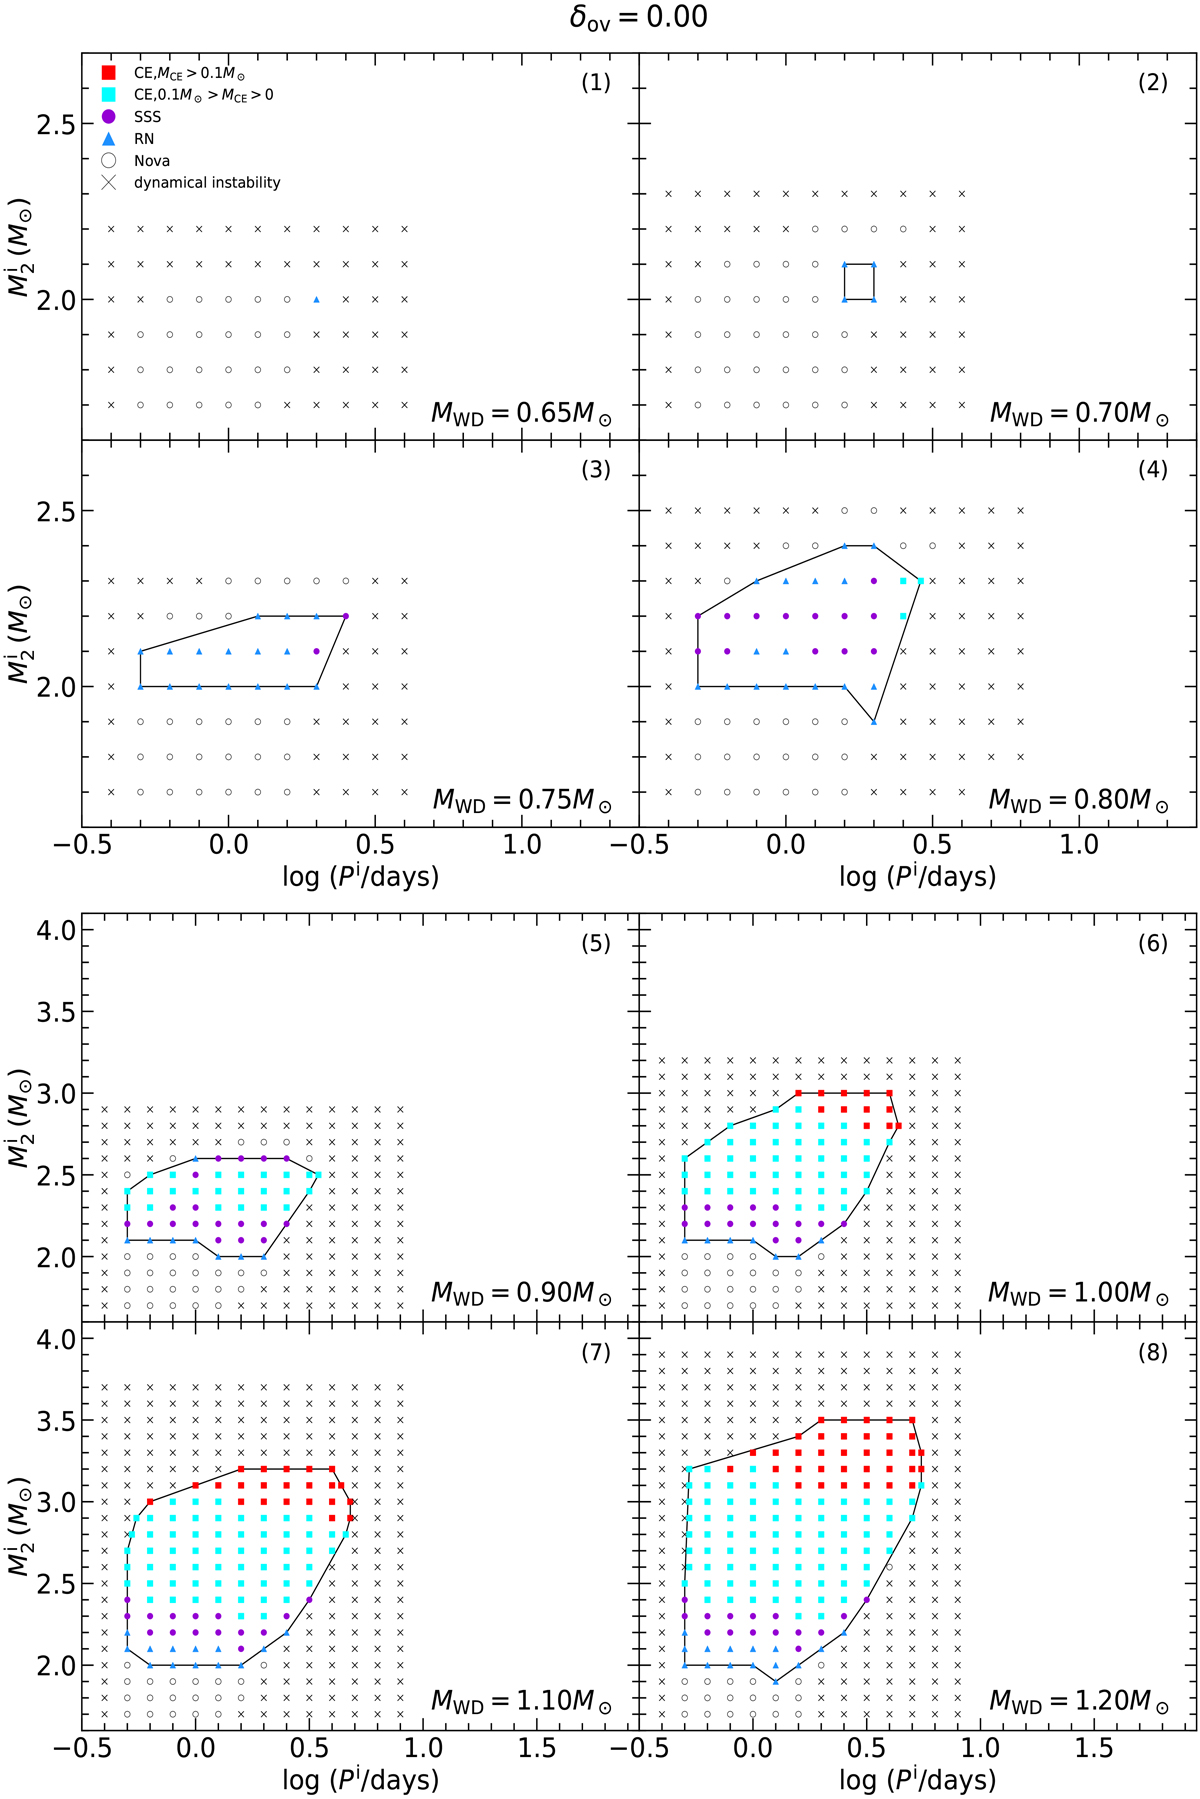
Final binary evolution calculations for δov = 0.00, shown in the initial orbital period-secondary mass (log Pi, M2i) plane, where Pi represents the initial orbital period and M2i is the initial mass of the donor star (for various initial WD masses, as indicated in each panel). Filled squares indicate SN Ia explosions during the CE phase (the red indicates MCE > 0.1 M⊙, the blue 0.1 M⊙ > MCE > 0). Filled circles denote SN Ia explosions in the SSS phase (![]() and MCE = 0), and filled triangles in the RN phase (
and MCE = 0), and filled triangles in the RN phase (![]() and MCE = 0). Open circles represent systems that experience nova explosions, preventing the CO WD from reaching 1.378 M⊙ (
and MCE = 0). Open circles represent systems that experience nova explosions, preventing the CO WD from reaching 1.378 M⊙ (![]() and MCE = 0), while crosses show systems that are unstable due to dynamical mass transfer.
and MCE = 0), while crosses show systems that are unstable due to dynamical mass transfer.
Current usage metrics show cumulative count of Article Views (full-text article views including HTML views, PDF and ePub downloads, according to the available data) and Abstracts Views on Vision4Press platform.
Data correspond to usage on the plateform after 2015. The current usage metrics is available 48-96 hours after online publication and is updated daily on week days.
Initial download of the metrics may take a while.