Fig. 2.
Download original image
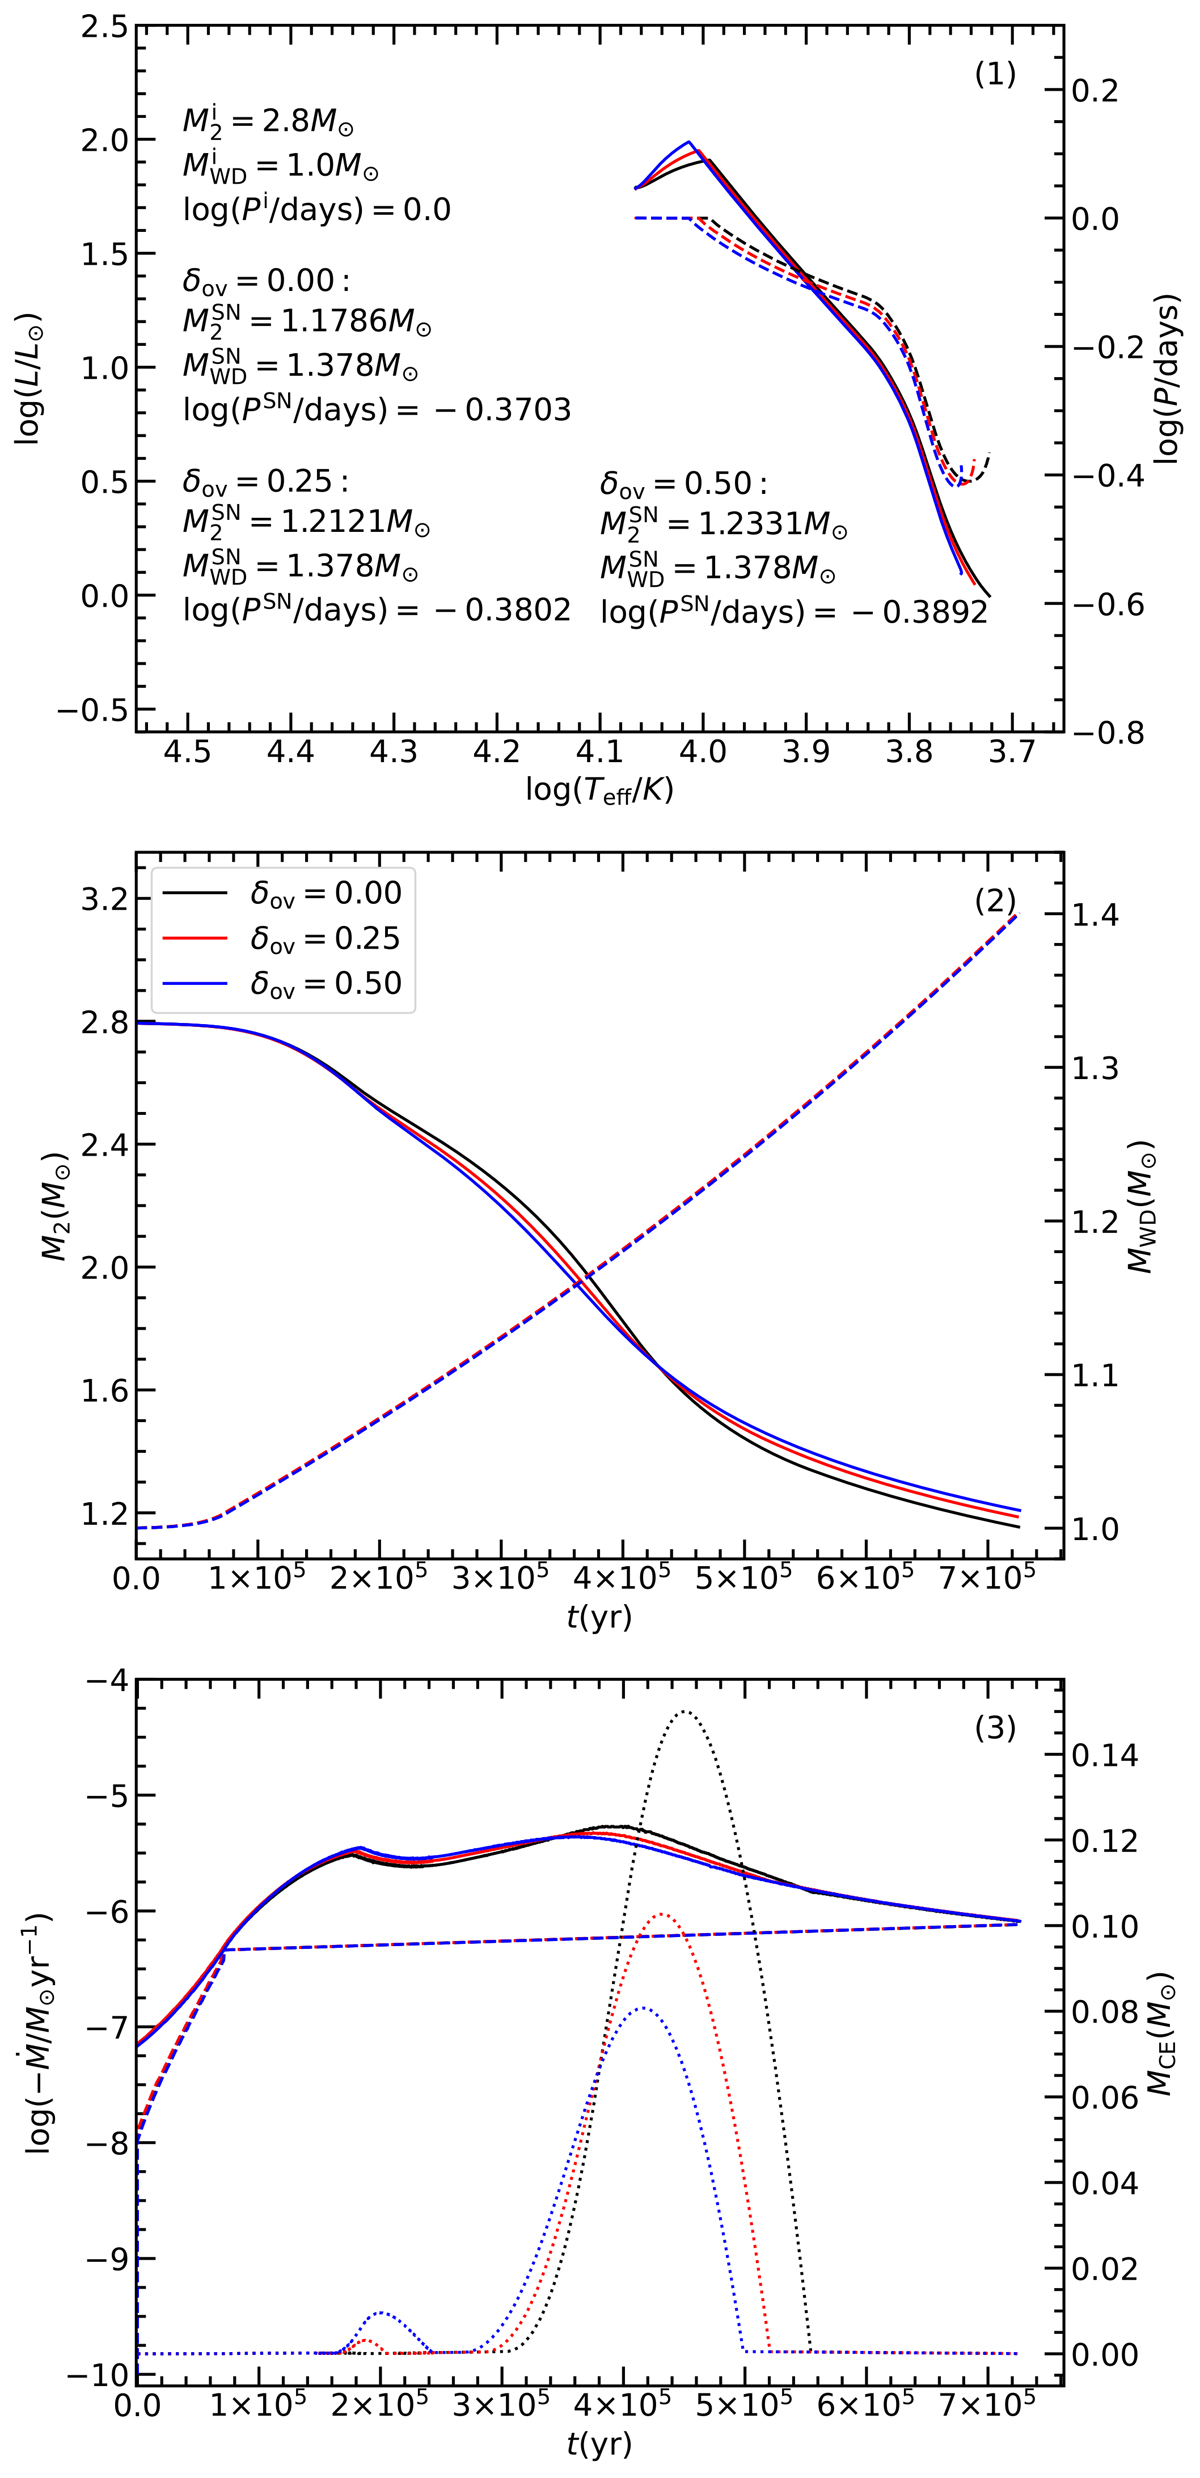
Example of binary evolution. In panel (1), the evolutionary tracks of the donor stars are represented by solid lines and the orbital period evolution with dashed curves. In panel (2), the solid and dashed lines indicate the donor star mass (M2) and the WD mass (MWD), respectively. In panel (3), the solid, dashed, and dotted lines correspond to the mass transfer rate (![]() ), the mass growth rate of the CO WD (
), the mass growth rate of the CO WD (![]() ), and the mass of the CE (MCE), respectively. The black, red, and blue lines represent δov = 0.00, 0.25, and 0.50, respectively. The initial binary parameters and the parameters at the time of the SN Ia explosion are also provided in panel (1).
), and the mass of the CE (MCE), respectively. The black, red, and blue lines represent δov = 0.00, 0.25, and 0.50, respectively. The initial binary parameters and the parameters at the time of the SN Ia explosion are also provided in panel (1).
Current usage metrics show cumulative count of Article Views (full-text article views including HTML views, PDF and ePub downloads, according to the available data) and Abstracts Views on Vision4Press platform.
Data correspond to usage on the plateform after 2015. The current usage metrics is available 48-96 hours after online publication and is updated daily on week days.
Initial download of the metrics may take a while.