Fig. 9.
Download original image
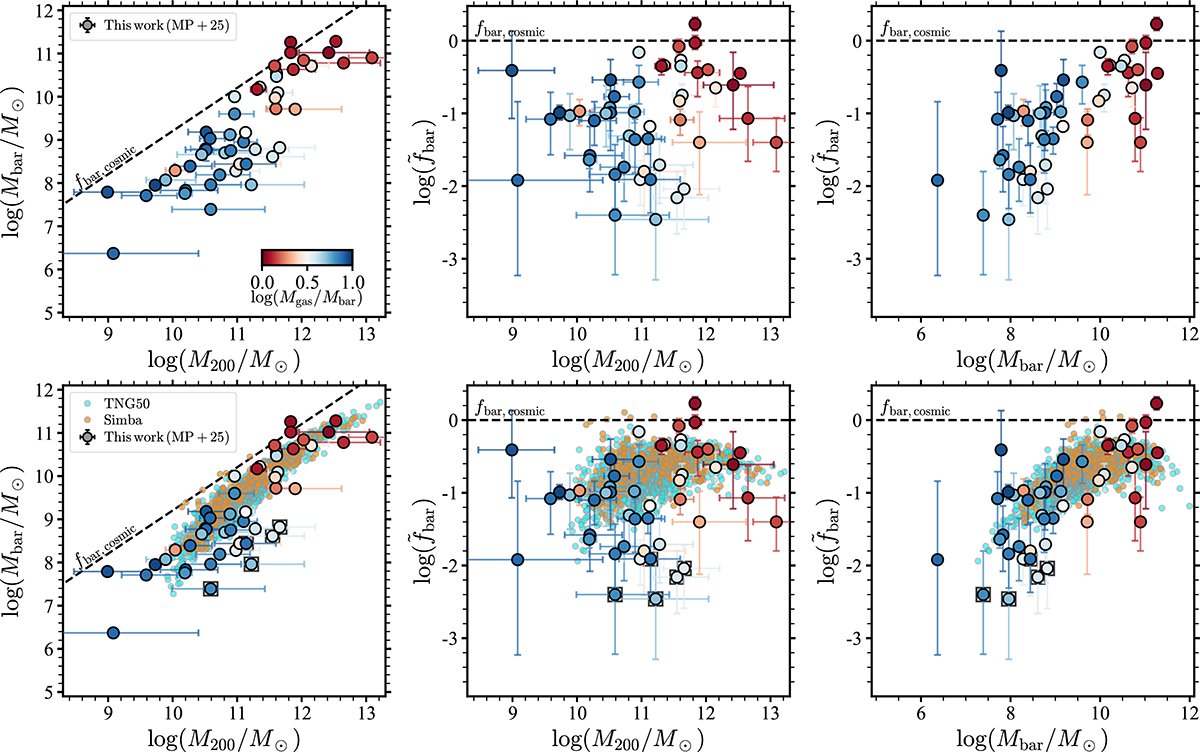
Relations between baryonic and halo mass in our sample. The left panels show Mbar vs. M200, while the middle and right panels show ![]() as a function of M200 and Mbar, respectively. The observations are colour-coded by the Mgas/Mbar ratio. All panels highlight the cosmological baryon fraction fbar, cosmic. The bottom panels also include comparisons with TNG50 (cyan) and Simba (orange) galaxies. The bottom panels highlight with squares those galaxies with M* lower than abundance-matching expectations by more than an order of magnitude.
as a function of M200 and Mbar, respectively. The observations are colour-coded by the Mgas/Mbar ratio. All panels highlight the cosmological baryon fraction fbar, cosmic. The bottom panels also include comparisons with TNG50 (cyan) and Simba (orange) galaxies. The bottom panels highlight with squares those galaxies with M* lower than abundance-matching expectations by more than an order of magnitude.
Current usage metrics show cumulative count of Article Views (full-text article views including HTML views, PDF and ePub downloads, according to the available data) and Abstracts Views on Vision4Press platform.
Data correspond to usage on the plateform after 2015. The current usage metrics is available 48-96 hours after online publication and is updated daily on week days.
Initial download of the metrics may take a while.