Fig. 6.
Download original image
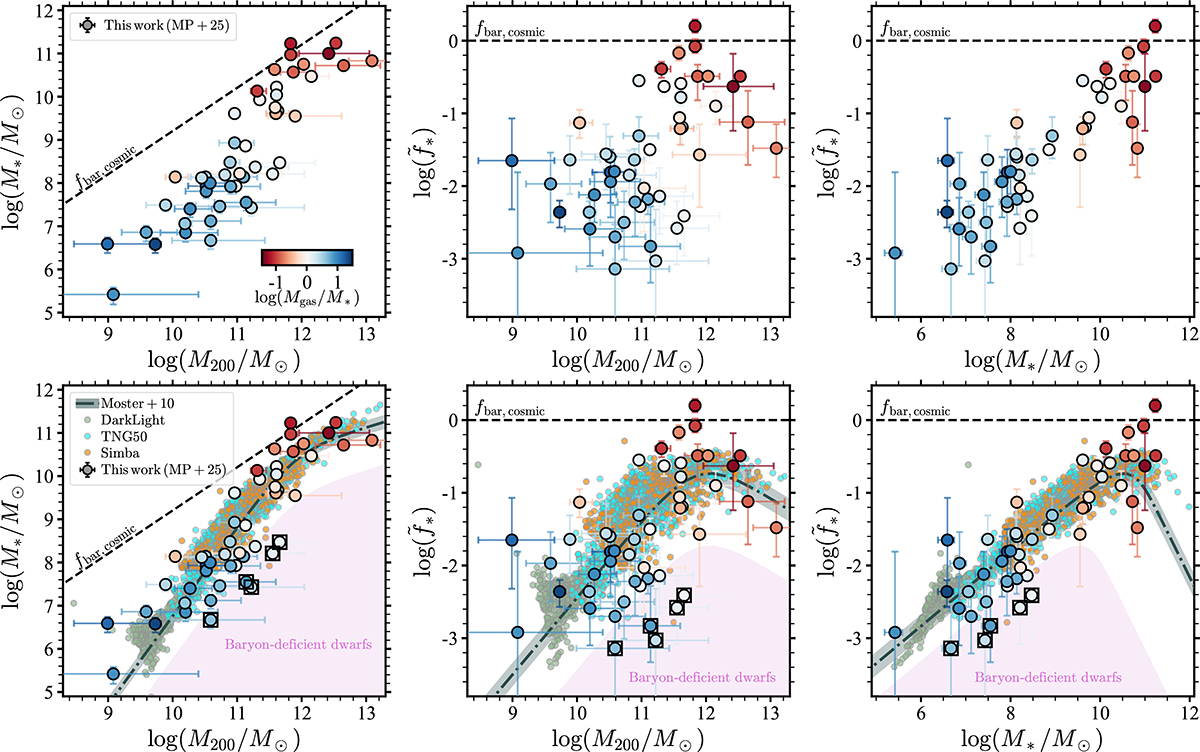
Relations between stellar and halo mass in our galaxy sample. The left panels show M* vs. M200, while the middle and right panels show ![]() as a function of M200 and M*, respectively. The observations are colour-coded by the log(Mgas/M*) ratio. All panels highlight the cosmological baryon fraction fbar, cosmic. In the bottom panels, we contrast our observations against the abundance-matching model of Moster et al. (2010), the semi-empirical DarkLight model (light green, Kim et al. 2024a) and the TNG50 (cyan, Nelson et al. 2019) and Simba (orange, Davé et al. 2019) cosmological hydrodynamical simulations. The bottom panels highlight a population of observed baryon-deficient dwarfs (BDDs, squares enclosing circles), characterised by having stellar masses more than one order of magnitude below abundance-matching expectations (plum region).
as a function of M200 and M*, respectively. The observations are colour-coded by the log(Mgas/M*) ratio. All panels highlight the cosmological baryon fraction fbar, cosmic. In the bottom panels, we contrast our observations against the abundance-matching model of Moster et al. (2010), the semi-empirical DarkLight model (light green, Kim et al. 2024a) and the TNG50 (cyan, Nelson et al. 2019) and Simba (orange, Davé et al. 2019) cosmological hydrodynamical simulations. The bottom panels highlight a population of observed baryon-deficient dwarfs (BDDs, squares enclosing circles), characterised by having stellar masses more than one order of magnitude below abundance-matching expectations (plum region).
Current usage metrics show cumulative count of Article Views (full-text article views including HTML views, PDF and ePub downloads, according to the available data) and Abstracts Views on Vision4Press platform.
Data correspond to usage on the plateform after 2015. The current usage metrics is available 48-96 hours after online publication and is updated daily on week days.
Initial download of the metrics may take a while.