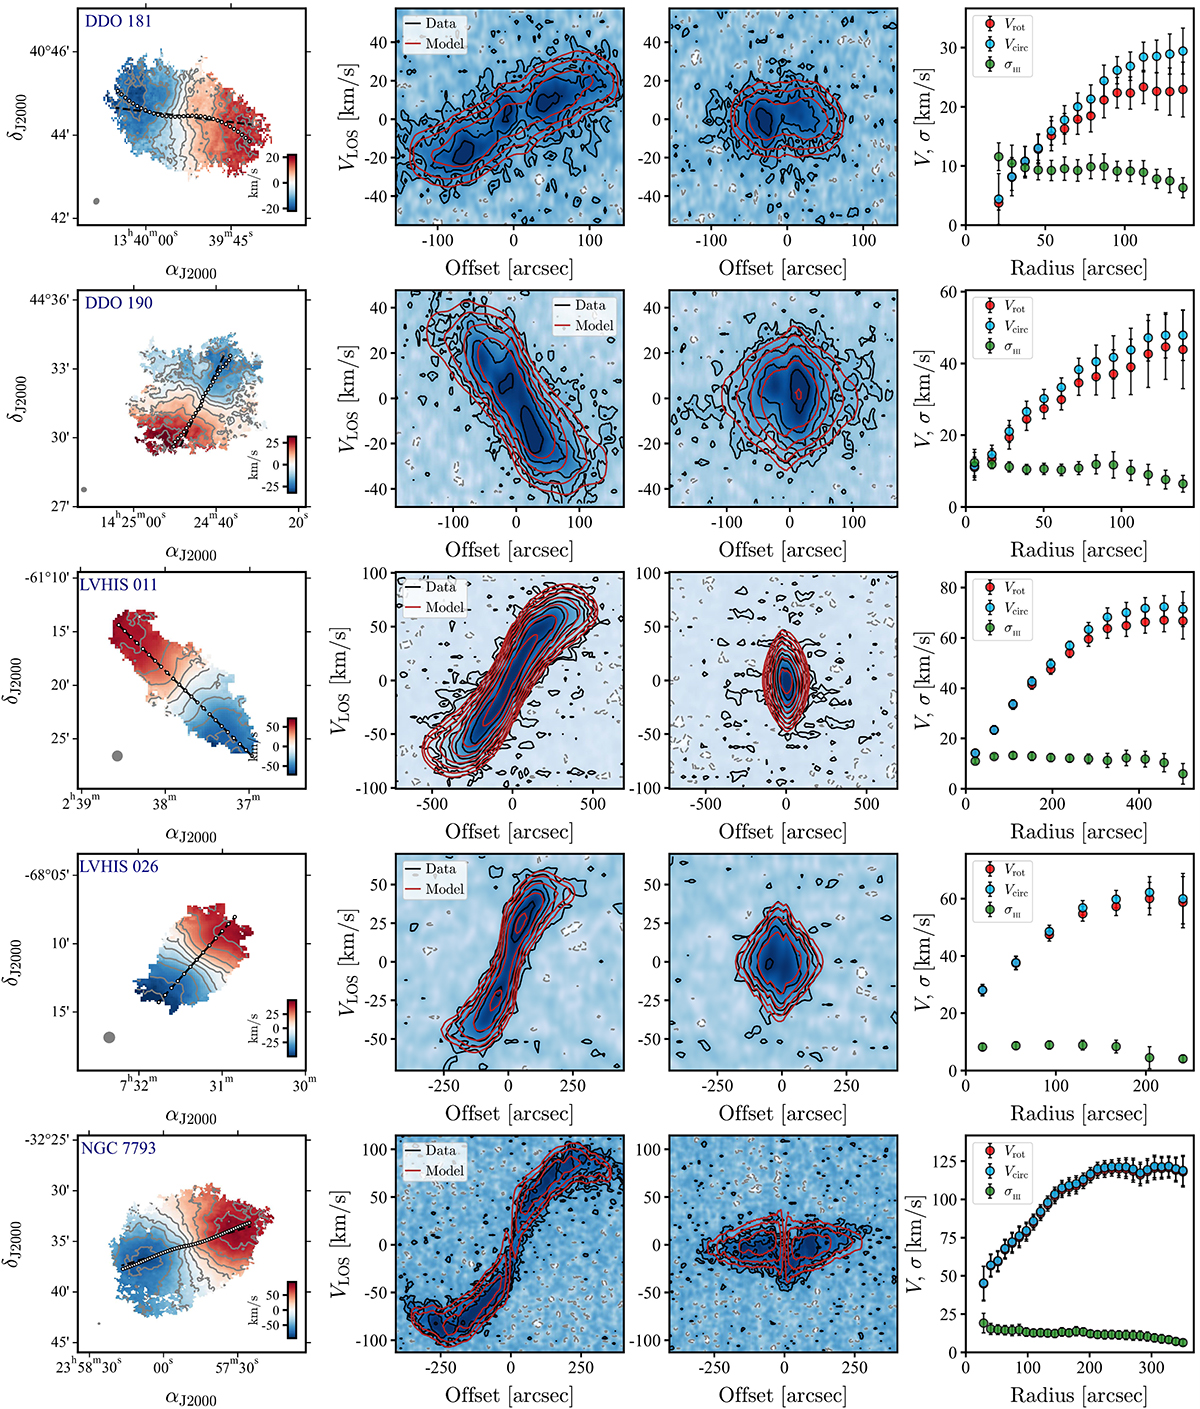
Fig. 2.
Download original image
Kinematics of four representative galaxies in our sample (see also Fig. B.1). (a): Velocity field (first moment map). We also show the kinematic (white circles) and average (black dashed lines) position angles as well as the beam (grey ellipse) of the observations. (b) and (c): Position-velocity slices along the average major (b) and minor (c, perpendicular to b) axes. The data are represented with a blue background and black contours (grey for negative values), while the best-fitting 3DBarolo model is shown with red contours. Contours are plotted at 2n× the noise, with n = 1, 2, …, n. (d) Rotation curve, circular speed, and gas velocity dispersion. We emphasise that the velocity fields are shown for illustration purposes, but 3DBarolo fits the entire data cube.
Current usage metrics show cumulative count of Article Views (full-text article views including HTML views, PDF and ePub downloads, according to the available data) and Abstracts Views on Vision4Press platform.
Data correspond to usage on the plateform after 2015. The current usage metrics is available 48-96 hours after online publication and is updated daily on week days.
Initial download of the metrics may take a while.